American Statistical Association
How Fast Are You?
Quick! Snap up the lesson plan. Scholars first use an online app to collect data on reaction times by clicking a button when the color of a box changes. They then plot and analyze the data by considering measures of center, measures of...
Shodor Education Foundation
Box Plot
What information can come from a box? Learners choose a data set to display as a box plot and decide whether to include the median in the calculation of the quartiles, show the outliers, and change the scale. To finish the lesson,...
Curated OER
Button Bonanza
Collections of data represented in stem and leaf plots are organized by young statisticians as they embark some math engaging activities.
McGraw Hill
Lesson 12: Absolute Mean Deviation
Learn a different way to determine variability. An informative lesson provides directions on how to calculate the mean absolute deviation of a data set. Pupils use examples to learn the process and then practice finding the mean absolute...
Statistics Education Web
How High Can You Jump?
How high can your pupils jump? Learners design an experiment to answer this question. After collecting the data, they create box plots and scatter plots to analyze the data. To finish the lesson, they use the data to draw conclusions.
Virginia Department of Education
Linear Curve of Best Fit
Is foot length to forearm length a linear association? The class collects data of fellow scholars' foot length and the length of their forearms. They plot the data and find a line of best fit. Using that line, they make predictions of...
Space Awareness
A View From Above
Analyzing and interpreting satellite data takes knowledge and patience. Through a detailed lab investigation, young scholars learn the process of analyzing this data. They use technology to create color images and maps from real...
Virginia Department of Education
May I Have Fries with That?
Not all pie graphs are about pies. The class conducts a survey on favorite fast food categories in a lesson on data representation. Pupils use the results to create a circle graph.
American Statistical Association
Armspans
Young mathematicians collect data on the arm spans of classmates. Then they sort the data by measures of center, spread, and standard deviation. Finally, they compare groups, such as boys and girls, to interpret any differences.
Statistics Education Web
Types of Average Sampling: "Household Words" to Dwell On
Show your classes how different means can represent the same data. Individuals collect household size data and calculate the mean. Pupils learn how handling of the data influences the value of the mean.
Rice University
Introductory Statistics
Statistically speaking, the content covers several grades. Featuring all of the statistics typically covered in a college-level Statistics course, the expansive content spans from sixth grade on up to high school. Material comes from a...
NOAA
The Oceanographic Yo-yo
How does chemistry help deep-sea explorers? Part four of a five-part series of lessons from aboard the Okeanos Explorer introduces middle school scientists to technologies used in ocean exploration. Groups work together to analyze data...
Shodor Education Foundation
Plop It!
Build upon and stack up data to get the complete picture. Using the applet, pupils build bar graphs. As the bar graph builds, the interactive graphically displays the mean, median, and mode. Learners finish by exploring the changes in...
EngageNY
Distributions—Center, Shape, and Spread
Data starts to tell a story when it takes shape. Learners describe skewed and symmetric data. They then use the graphs to estimate mean and standard deviation.
Chicago Botanic Garden
Climate Change Around the World
You know climate change is happening when you see a bee take off its yellow jacket. Part four in a series of five lessons explores all factors affecting climate change: temperature, cloud cover, precipitation, and carbon dioxide. By...
Bowland
Football, the Beautiful Game
Discover how to use mathematics to make a stronger soccer team. Young soccer enthusiasts use given data to make decisions about a soccer team. They decide which position to assign each player, consider what makes a good pass and...
Population Connection
Where Do We Grow from Here?
Did you know that the population is expected to grow to 11 billion by 2100? The resource serves final installment in a six-part series on the global population and its effects. Scholars interpret data from the United Nations about the...
Curated OER
Measures of Central Tendency: Range
In this measures of central tendency learning exercise, students complete 40 problems in which a set of data is analyzed and the range is calculated. This page is intended as an online activity, but may be completed on paper.
Curated OER
Dynamic Data Range, Mode, and Median
Students practice statistics skills by calculating range, mode, and median. In this 4th - 6th grade lesson plan, students calculate range, median, and mode of given numbers while playing a game.
Curated OER
Describing Data
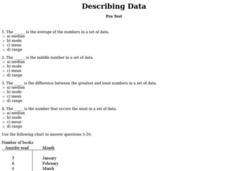
In this data worksheet, students complete multiple choice questions about mean, median, mode, and range. Students complete 10 questions total.
Curated OER
Mean, Median, Mode and Range
Seventh graders identify the mean, mode, median and range in a given set of data. After playing "What's My Number" game, 7th graders brainstorm situations in which measurement of statistical data is important. They measure specified...
Curated OER
Range and Mode
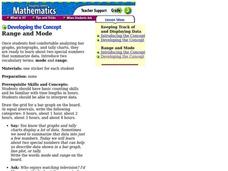
Fifth graders interpret data. In this mode and range instructional activity, 5th graders define mode and range and practice finding them given a set of data.
Curated OER
Data Analysis
In these data analysis worksheets, students complete 4 worksheets of activities for analyzing data. Students use the mean, median, mode, and range to organize the data.
Curated OER
Range and Mode Reteach 4.5
In this range and mode worksheet, students analyze the data table and graph that show numbers of books read. Students use the data to answer 4 questions.


