Balanced Assessment
Stock Market
Analyze trends in the stock market using histograms. Future economists use data presented in a histogram to find periods of greatest increase and decrease. They also draw conclusions about days that would be best to invest.
Mathed Up!
Frequency Polygons
Frequency polygons are a different way to represent frequencies over intervals. Pupils take frequencies for intervals of data from a frequency table and plot them as a frequency polygon. Budding mathematicians find information about the...
EngageNY
From Ratio Tables, Equations and Double Number Line Diagrams to Plots on the Coordinate Plane
Represent ratios using a variety of methods. Classmates combine the representations of ratios previously learned with the coordinate plane. Using ratio tables, equations, double number lines, and ordered pairs to represent...
Inside Mathematics
Party
Thirty at the party won't cost any more than twenty-five. The assessment task provides a scenario for the cost of a party where the initial fee covers a given number of guests. The class determines the cost for specific numbers of guests...
Inside Mathematics
Quadratic (2006)
Most problems can be solved using more than one method. A worksheet includes just nine questions but many more ways to solve each. Scholars must graph, solve, and justify quadratic problems.
Concord Consortium
Center of Population
Let the resource take center stage in a lesson on population density. Scholars use provided historical data on the center of the US population to see how it shifted over time. They plot the data on a spreadsheet to look the speed of its...
Illustrative Mathematics
Puppy Weights
Nobody can say no to puppies, so lets use them in math! Your learners will take puppy birth weights and organize them into different graphs. They can do a variety of different graphs and detail into the problem based on your classroom...
College Board
2006 AP® Statistics Free-Response Questions
Catapult the class into the test. Released items from the free-response section of the 2006 AP® Statistics exam ask individuals to use statistics to figure out the best catapult for determining the accuracy of thermometers. The six...
Curated OER
2008 U.S. National Chemistry Olympiad Part I
In this chemistry Olympiad learning exercise, students solve sixty multiple choice questions on a variety of chemistry topics from finding molarity of solutions to calculating products of reactions. Students are given graphs, equations,...
Curated OER
Foxes and Rabbits 3
Use realistic data to find trigonometric models that best fit the populations of foxes and rabbits in a national park. Included are detailed explanations of the answers and process. This is a follow-up exercise to the lesson listed in...
Curated OER
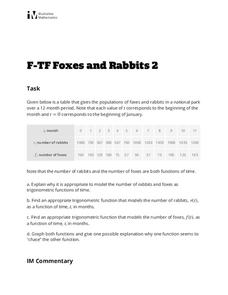
Foxes and Rabbits 2
Explore the relationship between the population of foxes and rabbits in a national park using trigonometric models. Plot data and find the appropriate trigonometric functions. Two questions require interpretation and explanation of...
Illustrative Mathematics
Average Cost
Here is an activity that presents a good example of a function modeling a relationship between two quantities. John is making DVDs of his friend's favorite shows and needs to know how much to charge his friend to cover the cost of making...
Concord Consortium
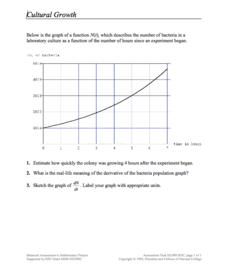
Cultural Growth
Scholars read and interpret a graph relating bacterial growth in a culture over time. They apply knowledge of derivatives, estimation, and graphing to the skill practice questions.
Mathed Up!
Cumulative Frequency and Box Plots
Learn how to display data. Young data analysts watch a video to review how to create cumulative frequency histograms and box plots. They work on a set of questions to practice producing these data displays.
Curated OER
Taxi!
Your young taxi drivers evaluate and articulate the reasoning behind statements in a conceptual task involving linear data. The given data table of distances traveled and the resulting fare in dollars is used by learners to explore...
California Education Partners
Animals of Rhomaar
Investigate the growth rates of alien animals. Pupils study fictional animals from another planet to determine how much they grow per year. The investigators plot the growth of their animals over a period of time and then compare them to...
College Board
2018 AP® Biology Free-Response Questions
The average AP Biology score dropped in 2018 with the addition of more data tables and graphs. Offer additional practice free-response questions by using the questions from the 2018 AP exam covering phylogenetic trees, cell structure and...
Pearson
End of Year Practice Test (Algebra I)
This complete multiple choice and short answer practice end-of-year test for algebra 1 offers a wealth of opportunities for customization. Offer it as a whole, to track progress or prepare the class for the format of the test, or...
Illustrative Mathematics
Invertible or Not?
Two for one—create an invertible and non-invertible function from the same data. The task presents a function table with missing outputs for the class to use to create two functions. One of the functions should have an inverse while the...
Illustrative Mathematics
Function Rules
Function machines are a great way to introduce the topic of functions to your class. Here, you will explore the input and output to functions both using numerical and non-numerical data. Learners are encouraged to play with different...
Science Matters
Formative Assessment #2: Circulatory System Performance Assessment
Watch as your pupils' hearts get pumping! An interactive activity has individuals record their heart rates after completing different activities. Each task has a different degree of physical activity. They then graph their results and...
Illustrative Mathematics
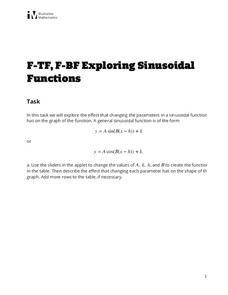
Exploring Sinusoidal Functions
What effect does changing a parameter have on the graph of a trigonometric function? Pupils use a Desmos applet to explore the general sine graph. They experiment changing different parameters and record the resulting change of the...
PBS
Working with Coordinate Planes: Assessments
It's time for scholars to show what they know about coordinate planes with a collection of three assessments. The exams' objectives include plotting points on a single grid, measuring using the distance formula, and identifying points on...
Mathematics Assessment Project
Middle School Mathematics Test 4
Raise expectations in your classroom and assess learners through the provided performance tasks. Class members must apply concepts learned throughout the year, providing a good measurement of how well they understand the material. The...
Other popular searches
- Graphing and Analyzing Data
- Graphing and Inputting Data
- Graphing Census Data
- Graphing Using Census Data
- Graphing and Data Entry
- Graphing Weather Data
- Graphing Population Data
- Graphing and Data
- Graphing Scientific Data
- Scientific Data and Graphing
- Science Data and Graphing
- Graphing Science Data


