Code.org
Cleaning Data
"Clean the data!" "I did not know it was dirty." Introduce your class to the process of cleaning data so that it can analyze it. Groups work through a guide that demonstrates the common ways to filter and sort data. Pairs then...
CK-12 Foundation
Graphs for Discrete and for Continuous Data: Discrete vs. Continuous Data
Not all data is the same. Using the interactive, pupils compare data represented in two different ways. The learners develop an understanding of the difference between discrete and continuous data and the different ways to represent each...
CK-12 Foundation
Types of Data Representation: Baby Due Date Histogram
Histograms are likely to give birth to a variety of conclusions. Given the likelihood a woman is to give birth after a certain number of weeks, pupils create a histogram. The scholars use the histogram to analyze the data and answer...
Code.org
Making Data Visualizations
Relax ... now visualize the data. Introduce pupils to creating charts from a single data set. Using chart tools included in spreadsheet programs class members create data visualizations that display data. The activity encourages...
Curated OER
Graphs that Represent Data Sets
These four scenarios all contain graphable data; can scholars match them to the correct bar graphs? All the data is in single-digit whole numbers. Some of the scenarios instruct kids to make a graph, while others don't. Clarify...
CK-12 Foundation
Data Summary and Presentation: Chart for Grouping Data
Get social! Create a display of social media use for a class. Pupils use provided information about the time spent on social media to construct a histogram. Using the histogram, learners interpret the data to answer questions.
Curated OER
"Data Dabble"
Young scholars engage in a lesson which facilitates their use of web sites to find data, graph it, and interpret it, thus scaffolding graphing skills to prepare students for their 8th grade I-search exit project.
CK-12 Foundation
Fitting Lines to Data
Scatter the TV sales over weeks. Pupils create a scatter plot to display the number of TV sales over a period of several weeks. The interactive allows class members to create two lines of best fit. Then they determine which line fits...
CK-12 Foundation
Line Graphs to Display Data Over Time: Strawberry Competition
Take the tediousness out of graphing. Using the interactive tool, learners can efficiently create a line graph from a set of data. They then use the graph to answer questions about specific trends in the data.
Curated OER
Collect and Organize Data - Practice 14.1
In this data collection worksheet, students read the word problem and study the tally chart about favorite sports. Kids then use the information in the chart to answer the questions. Students then use the list about students' favorite...
Kenan Fellows
Designing and Analyzing Data Collected from Wearable Devices to Solve Problems in Health Care
Wearable devices have become more the norm than the exception. Learners analyze data from a sample device with a regression analysis in a helpful hands-on lesson. Their focus is to determine if there is a connection between temperature...
Curated OER
Presentation of Quantitative Data- Vertical Line Diagrams
In this quantitative data worksheet, students examine how vertical line diagrams can be used to display discrete quantitative data. They read about the use of tally charts to create vertical line graphs that display the data. They...
Curated OER
Using Data to Determine the Location of the Stiffest Opposition to School Desegregation in the 1970's
Students analyze historical data. In this school desegregation lesson plan, students make predictions about opposition to desegregation, examine the provided desegregation data, and determine if their predictions were correct.
Curated OER
How to Draw a Bar Chart Correctly
Your class has gathered their data, so what's the next step? They need to display and analyze their data, and a bar chart is a perfect tool for the job. This resource provides the step-by-step instructions those kids need to construct a...
PHET
Least-Squares Regression
Less is best when looking at residuals. Scholars use an interactive to informally fit a linear regression line to data on a scatter plot. The interactive provides a correct best fit line with residuals and correlation coefficient to...
CK-12 Foundation
Frequency Tables to Organize and Display Data: Favorite Films
What information can your class determine if they know the number of people attending movie showings? Using the information about the number of people at each screening, learners develop a frequency table. The pupils analyze the type of...
CK-12 Foundation
Variance of a Data Set
Use variable value sliders to understand variance. The interactive shows four whole numbers, their mean and deviation. Using the information, pupils find the variance of the numbers and respond to question related to the understanding of...
Inside Mathematics
Population
Population density, it is not all that it is plotted to be. Pupils analyze a scatter plot of population versus area for some of the states in the US. The class members respond to eight questions about the graph, specific points and...
Illustrative Mathematics
Data Transfer
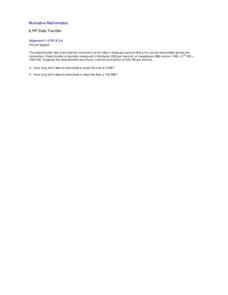
A question to ask your class is, How fast is your Internet? That depends on the data transfer rate (DTR), which is the unit rate used in this activity. Math students will calculate how long it takes to download a music file and a video...
Curated OER
Measurement and Data Collecting using Image Processing
Young scholars trace the route of the historical event and measure the distance over which the people involved journeyed. A data sheet be constructed outlining the location of events, and the speed with which the journey occurred.
CK-12 Foundation
Understand and Create Histograms: Car Sales
Create a history of car sales. Pupils create a histogram/bar graph to show the number of car sales made during the week. Using the data display, learners calculate numerical summaries of the data and find the percent of cars sold during...
CK-12 Foundation
Mode: Boxes of Oranges
See how your data stacks up. Pupils stack crates of oranges in increasing order, creating a simple bar graph. Using the graph, individuals determine measures of center and describe the shape of the distribution. Scholars determine what...
Curated OER
Figure This! Math Challenges for Families
Young mathematicians complete a family math challenge packet. They will complete a packet of mixed math activities. They work with graphs, comparing numerical data, tessellations, and probability.
Curated OER
Using a Table
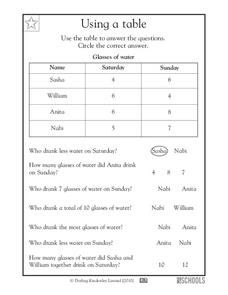
Tables are no help if your scholars can't read them; provide some excellent beginner-practice using this table example and accompanying comprehension questions. Learners examine the data first, which charts the number of glasses of water...


