Curated OER
Climate Comparison Charts
In this comparing climate charts worksheet, students record average monthly temperatures and average monthly precipitations on two charts. Students record twenty-four monthly statistics.
Curated OER
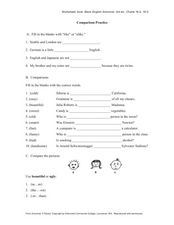
Comparison Practice
In this comparisons instructional activity, students fill in the blanks in 4 sentences with the words "like" or "unlike". Students then change the form of the adjective provided in 10 sentences that compare two things.
San José State University
Organizational Patterns for the Comparison/Contrast Essay
Organization is key in essay writing. The two organizational charts included in this resource model the block approach and the point-by-point approach to organizing a compare and contrast style essay. After examining the charts, writers...
Curated OER
Quadratic Applications
In this quadratic applications worksheet, students complete graphs, charts, comparison charts, and more having to do with quadratic equations. Students complete 5 different activities.
Curated OER
Financial Institution Comparison
Once learners are ready to choose a bank, how do they make a smart decision for their financial needs? Scholars help each other by jigsawing the research in groups. After introducing checking and savings accounts with the attached...
EngageNY
Text to Film Comparison: Bottom the Fool
Pretty ugly, jumbo shrimp. Oxymorons are awfully good! Scholars reread Act I, scene 2 from Shakespeare's A Midsummer Night's Dream while participating in a drama circle. Next, they begin working on anchor charts to dissect Shakespeare's...
CK-12 Foundation
Interpretation of Circle Graphs: Northwest Region Population Pie
Given populations of the five Northwestern states, learners create a circle graph. Using the data and the pie chart, they make comparisons between the populations of the states. Finally, the pupils determine how the chart will change...
University of North Carolina
Comparing and Contrasting
Not all compare and contrast assignments have writers compare and contrast in the same way. Some only ask for comparisons, others only ask for contrasts, and many require more focus than a simple list of similarities and differences....
Center for Learning in Action
Density
Explore the concept of density within states of matter—gases, liquids, and solids—through a group experiment in which young scientists test objects' texture, color, weight, size, and ability to sink or float.
Curated OER
The Iditarod Race Compared with the Movie, Iron Will
Feel the freezing rush of an Alaskan sled dog race in this reading lesson. Using research about the Iditarod Trail Sled Dog Race, seventh graders compare and contrast the depiction in the movie Iron Will. The lesson lasts for seven days...
Curated OER
Comparison Practice
For this comparison practice worksheet, students fill in the blanks in 14 sentences that require them to use comparative adjectives. Students also write 3 sentences using comparative adjectives and picture clues.
Curated OER
Chart problems involving car defects and customer service departments
In this interactive activity, learners solve two problems using the charts provided. Students must convey they are able to understand charts and how to read them.
Bowland
German or English?
Sprechen sie Deutsch? Future cryptographers must decide whether an unknown text is written in English or in German. They use provided pie charts about the frequency of words in the English and German languages to help make their decisions.
Beyond Benign
Water Bottle Unit
How much plastic do manufacturers use to create water bottles each year? The class explores the number of water bottles used throughout the years to determine how many consumers will use in the future. Class members compare different...
Curated OER
Handling Data
Students create a simple table in order to solve a problem. As a class, they create a simple data table in order to discover the number of letters in each student's name. This data is interpreted in order to answer questions and make...
Polk Bros Foundation
Assess with Charts: Compare and Contrast
If you're short on time and need a quick graphic organizer to help your learners connect history to the present, check out this resource. This worksheet can be useful for a visit to a museum or in conjunction with a reading assignment,...
Curated OER
A Comparison of Cloud Coverage Over Africa
Students use a NASA satellite data to contrast amounts of cloud coverage over different climate regions in Africa. They explore how Earth's major air circulations affect global weather patterns, and relate to local weather patterns.
Curated OER
Radiation Comparison Before and After 9-11
Using the NASA website, class members try to determine if changes could be detected in cloud cover, temperature, and/or radiation measurements due to the lack of contrails that resulted from the halt in air traffic after the attacks of...
Delegation of the European Union to the United States
The Geography of Europe
What is the European Union? Where is it? Why is it? To begin a study of the EU, class members examine the physical geography of Europe and the size and population density of 28-member countries in comparison to non-member countries like...
Curated OER
A Data Processing Lesson for Statistics -- Reading a Table or Chart
Students identify the structure and key parts of tables and charts. They determine which data is meanjngful and make comparisons with the data. They describe the scope of the AIDS plague throughout the world.
Curated OER
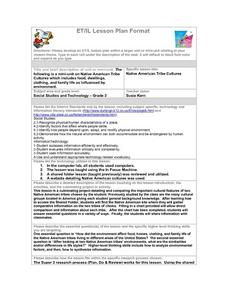
Native American Tribe Cultures
Third graders choose two Native American tribes to compare and contrast using an assigned website. They complete a chart that shows how the tribes are the same and different. Using information gathered on their charts, they answer...
Virginia Department of Education
Graphs
Examine different types of graphs as a means for analyzing data. Math scholars identify the type of graph from a series of data displays and then develop questions to match each one. Then, given a scatter plot of height versus age data,...
Curated OER
The Use of Language in "I Know Why the Caged Bird Sings"
Readers of I Know Why the Caged Bird Sings are asked to craft an essay in which they compare how Maya Angelou uses figurative language to depict herself and Mrs. Flowers.
K12 Reader
Displaying Data
It's important to learn how to display data to make the information easier for people to understand. A reading activity prompts kids to use context clues to answer five comprehension questions after reading several paragraphs about...


