EngageNY
Creating a Histogram
Display data over a larger interval. The fourth segment in a 22-part unit introduces histograms and plotting data within intervals to the class. Pupils create frequency tables with predefined intervals to build histograms. They describe...
CK-12 Foundation
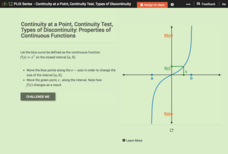
Continuity at a Point, Continuity Test, Types of Discontinuity: Properties of Continuous Functions
Take a closer look at continuous functions within given intervals. Using the parent cubic function, learners explore properties of continuous functions on intervals. Pupils interpret the Intermediate Value Theorem and the Extreme Value...
EngageNY
Interpreting the Graph of a Function
Groups sort through NASA data provided in a graphic to create a graph using uniform units and intervals. Individuals then make connections to the increasing, decreasing, and constant intervals of the graph and relate these connections...
CK-12 Foundation
Intermediate Value Theorem, Existence of Solutions: Function Exploration
Does the value exist? The interactive allows pupils to visualize the Intermediate Value Theorem. Using the visualization, individuals respond to questions using specific values and general values. The class comes to the conclusion what...
Curated OER
Telling Time
Young learners participate in activities which help them understand analog clocks, and the vocabulary of telling time. They examine the values of the intervals of minutes and hours by making a human clock.
Curated OER
Telling Time With Clocks/Bingo “Time”
Young learners create a clock by adding hands and placing the numbers in the correct location. After each learner has their very own clock, they explore each component. Review on the hour times, and then introduce them to five-minute...
Curated OER
Histograms and Bar Graphs
Students are introduced to histograms, bar graphs, and the concept of class interval. They use an activity and three discussions with supplemental exercises to help students explore how data can be graphically represented (and...
Curated OER
Central Tendency
In this central tendency activity, 8th graders solve 10 different problems that include determining the mean, mode, and median of various situations. First, they prepare a frequency distribution with a class interval for the data found...
Curated OER
Telling Time Bingo
Have your youngsters examine the difference between digital and analog clocks. Using They participate in a "Telling Time BINGO" game. Not only is this activity fun, but it provides the teacher with an opportunity to informally assess his...
Math Worksheets Land
Halloween Cartesian Art: Bat
Get the class batty over graphing. Young mathematicians plot ordered pairs in all quadrants of a Cartesian plane, and connect the points to create a bat.
EngageNY
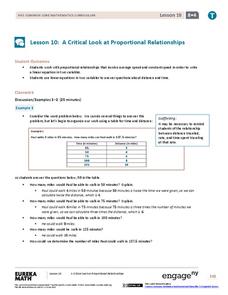
A Critical Look at Proportional Relationships
Use proportions to determine the travel distance in a given amount of time. The 10th installment in a series of 33 uses tables and descriptions to determine a person's constant speed. Using the constant speed, pupils write a linear...
Radford University
“FUN-ctions” Find the Equation of a Scream
Take a function along for a ride. Given the graph of a roller coaster track, pupils determine key features of the graph such as the maximum, minimum, intervals of increase and decrease, and roots. They figure out the equation of the...
Shodor Education Foundation
Skew Distribution
Slide the class into a skewed view. Learners alter the location of the median relative to the mean of a normal curve to create a skew distribution. They compare the curve to a histogram distribution with the same skewness.
Curated OER
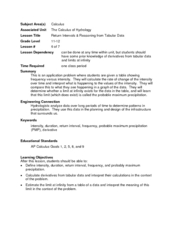
Return Intervals & Reasoning from Tabular Data
Students calculate derivatives from a set of data. In this calculus lesson, students estimate the limit at infinity. They complete a Return Interval handout at the end of the lesson.
Common Core Sheets
Creating Clocks (Half Hour Increments)
First graders create clocks by adding hour and minute hands pointing to the given time. All times are to be written in 30-minute intervals.
Balanced Assessment
On Averages and Curves
Determine the average on a curve. The class finds graphical representations of averages and expresses them both symbolically and on the graph. The assessment requires class members to justify using average to describe graphs.
EngageNY
Graphs of Piecewise Linear Functions
Everybody loves video day! Grab your class's attention with this well-designed and engaging resource about graphing. The video introduces a scenario that will be graphed with a piecewise function, then makes a connection to domain...
Curated OER
Mathematics: A Picture's Worth a Thousand Words
Students examine school yearbooks from 1950 to the present. They count the number of male and female teachers and administrators. They compile date and extrapolate changes in job trends.
EngageNY
Constant Rates Revisited
Find the faster rate. The resource tasks the class to compare proportional relationships represented in different ways. Pupils find the slope of the proportional relationships to determine the constant rates. They then analyze the rates...
NYSU
Understand a Fraction as a Number on a Number Line
Piece by piece young scholars build a basic understanding of fractions in a Common Core-designed elementary math lesson. Through a series of hands-on activities and journaling exercises, and with the help of multiple online resources,...
Inside Mathematics
Sorting Functions
Graph A goes with equation C, but table B. The short assessment task requires class members to match graphs with their corresponding tables, equations, and verbalized rules. Pupils then provide explanations on the process they used to...
CK-12 Foundation
Data Summary and Presentation: Chart for Grouping Data
Get social! Create a display of social media use for a class. Pupils use provided information about the time spent on social media to construct a histogram. Using the histogram, learners interpret the data to answer questions.
Lane Community College
Review Sheets: College Algebra
A jam-packed worksheet has all the topics you would teach in an Algebra II class with a variety of question styles. Starting with function notation and ending with geometric sequences, there really is something for everyone. Each topic...
Radford University
Skate Ramp
Going up and down makes a more exciting ride. Pupils recall what they know about continuity and limits of functions. Working in groups, classmates design a skateboard ramp that meets a given set of criteria, using at least three...


