CK-12 Foundation
Slope-Intercept Form of Linear Equations: Cable Car Tracks
Get on track to learn about slope-intercept form. Scholars use an interactive to position a line along the tracks of cable car. Applying knowledge of slope and intercepts, they write the slope-intercept form of the equation for the line.
CK-12 Foundation
Simplify Sums or Differences of Single Variable Expressions: Addition and Subtraction of Like Terms
Investigate the process of combining like terms using an interactive animation. Scholars tackle simplifying expressions by manipulating rectangles that represent the terms. They add and subtract terms to arrive at the result.
CK-12 Foundation
Function Rules for Input-Output Tables: Function Machine!
Watch as a function machine converts an input to an output. Learners determine the work applied by the function machine to write a function rule. Questions accompany the function machine animation to guide individuals to conclusions.
Curated OER
When is Your Animal Most Active?-- Class Bar Graph
In this science and math activity, a group of students participate in graphing what time of day their chosen animals are most active. Students fill out the bar graph choosing day or night.
Statistics Education Web
The Case of the Careless Zookeeper
Herbivores and carnivores just don't get along. Using a box of animal crackers, classes collect data about the injury status of herbivores and carnivores in the box. They complete the process of chi-square testing on the data from...
Bowland
AstroZoo
Rescue animals in the zoo by applying math concepts. Groups of learners solve three missions involving oxygen, food, and climate control. Each group selects an animal from one of four bio-domes.
Key Stage Fun
Squeebles Fractions
We are not exactly sure what a Squeeble is, but apparently they love cake and fractions, and your little bakers-turned-mathematicians will also. This app focuses on the basics of fractions including modeling fractions, equivalent...
CK-12 Foundation
Negative Exponents
Watch the exponent expression do the negative exponent dance! An interactive lesson uses an animation to show how negative exponents become positive. Learners manipulate the expression and then respond to conceptual questions.
CK-12 Foundation
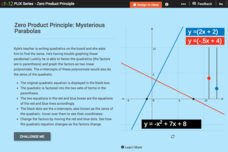
Zero Product Principle: Mysterious Parabolas
Be a hero, not a zero! Help your classes understand how to solve quadratic equations with the zero product property using an animated simulation. Using the controls, scholars manipulate the zeros and watch as the function and its factors...
CK-12 Foundation
Distributive Property: Catching Fireflies
Model the distributive property with jars of fireflies! An interactive animation has learners manipulate the number of jars of fireflies to determine the number caught. Accompanying questions ask scholars to consider the multiplication...
CK-12 Foundation
Multiple Line Graphs: Jack's Jumpshot
What are the advantages to seeing multiple data sets on the same graph? Scholars explore this question as they manipulate the animation within the lesson. Questions within the interactive ask individuals to make comparisons across the...
CK-12 Foundation
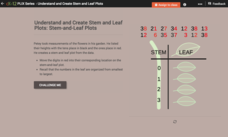
Understand and Create Stem-and-Leaf Plots: Stem-and-Leaf Plots
Explore the advantages to using a stem-and-leaf plot using an online lesson. Learners manipulate an animation to create a stem-and-leaf plot. They then calculate statistics for the data using their display. Guiding questions help them...
CK-12 Foundation
Mean: Arithmetic Mean
How is a mean affected by changes in data? A well-designed animation allows individuals to manipulate data and watch the effect on the mean. Challenge questions help guide users to conclusions about outliers and skew within data.
Curated OER
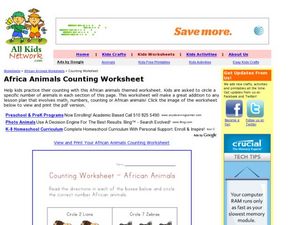
Africa Animals Counting Worksheet
In this animal counting worksheet, students read the directions for each box and circle the correct number of African animals. Students complete 4 boxes.
Curated OER
Science of Special Effects
This is a creative, multidisciplinary, well-designed lesson provided by Scientific American related to special effects. Students make their own animated short films and use math and computer skills.
Curated OER
Application of Function Composition
Young mathematicians solve composition of functions. They add, subtract, multiply and divide functions and then identify the domain and range of each function. An embedded animation shows three different applications of function...
Curated OER
Domain and Range 2
How do you identify the domain and range of the function? As learners find out it's as easy as creating a graph. They'll identify the domain and range of a relation from its graph, write symbolic expressions describing the relationship...
National Research Center for Career and Technical Education
Hospitality and Tourism 1: Safety and Sanitation
Math and science come alive in this career-related instructional activity on sanitation. Along the way, learners explore bacterial growth rates using exponential notation and graphs. A link to a very brief, but vivid video shows just how...
CK-12 Foundation
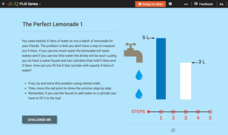
Problem Solving Plan, Mental Math: The Perfect Lemonade 1
Find the perfect amount of water for lemonade. Scholars solve the famous problem of measuring four liters of water using a three-liter container and a five-liter container. An interactive allows users to see each step of the solution.
CK-12 Foundation
Function Rules for Input-Output Tables: Function Machine 2
Model function operations using a function machine. An interactive lesson has learners determine the patterns of a double function machine. They use the patterns to write functions and make connections between the inputs and outputs.
CK-12 Foundation
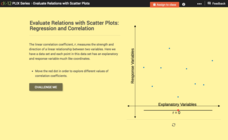
Evaluate Relations with Scatter Plots: Regression and Correlation
Introduce the concept of a correlation coefficient using an interactive lesson. Learners begin by manipulating a correlation coefficient and watching a graph change to represent the new value. Questions help strengthen their...
CK-12 Foundation
Stem-and-Leaf Plots and Histograms: Digital Photography
Cameras use histograms to communicate the exposure of a photograph. An interesting lesson uses this idea to help learners deepen their understanding of histograms. It highlights the skew of the graphs by showing under- and overexposed...
CK-12 Foundation
Simple Random Sampling: How Many Samples Does it Take to Change a Light Bulb?
Teach the concept of simple random sampling through an interactive lesson. Learners explore the concept by considering the strength of sampling methods. Size of the samples varies also as individuals determine which methods lead to the...
CK-12 Foundation
Create and Understand Box-and-Whisker Plots: Babies in a Waiting Room
Explore the strengths and weaknesses of box-and-whisker data display. An interactive lesson asks learners to create a box-and-whisker plot from a set of data. Challenge questions focus on determining what types of conclusions they can...
Other popular searches
- Animal Report Template
- First Grade Animal Report
- Writing Animal Reports
- Animal Book Report Template
- Animal Report Rubric
- Animal Report Writing
- 4th Grade Animal Reports
- Ocean Animal Report
- Writing an Animal Report
- Animal Report, Big Six
- Animal Report Project
- Endangered Animal Reports


