NOAA
Ground-truthing Satellite Imagery with Drifting Buoy Data
Ground-truthing ... is it even a word? The last installment of a five-part series analyzes how scientists collect sea surface temperature data. Scholars use government websites to compare temperature data collected directly from buoys...
Howard Hughes Medical Institute
Lesson 8: WildCam Gorongosa Data Analysis
How do scientists analyze data to get a specific answer to a question? The final chapter in an eight-part series of activities centered around Gorongosa National Park encourages scholars to dig deeper into the scientific process. After...
Curated OER
Deep Convective Clouds
Students observe clouds. In this deep convective clouds lesson, students analyze cloud data recorded over one month and draw conclusions based on results. Students predict "Thunderstorm Season" and prepare to defend their decision...
Curated OER
Using Vegetation, Precipitation, and Surface Temperature to Study Climate Zones
Using NASA's Live Access Server, earth scientists compare the temperature, precipitation, and normalized difference vegetation index for four different locations. They use the data to identify the climate zone of each location using...
Curated OER
Image Classification
Students explore what are "multi-spectral" or "multi-band" images? They investigate how landscapes change over time- at least over the time-span of satellite imagery, particulary due to human influences. Students explore how to train...
NOAA
Through Robot Eyes
How do robots assist ocean explorers in collecting data and images? The final installment in a five-part series has science scholars examine underwater images collected by robots and identify the organisms shown. Groups then calculate...
NASA
Observing Monsoon Weather Patterns with TRMM Data
Follow a fabulous slide show on how monsoons form and how satellite technology is being used to observe the phenomena, explaining why they occur. Afterward, visit the TRMM (Tropical Rainfall Measuring Mission) website to access actual...
NOAA
The Oceanographic Yo-yo
How does chemistry help deep-sea explorers? Part four of a five-part series of lessons from aboard the Okeanos Explorer introduces middle school scientists to technologies used in ocean exploration. Groups work together to analyze data...
Curated OER
Forest Fires
Learners play the role of a Ranger with the Department of Forestry. In this forest fires instructional activity, students examine data on biomes and images to determine high risk areas for forest fires to develop.
Association of American Geographers
Project GeoSTART
Investigate the fascinating, yet terrifying phenomenon of hurricanes from the safety of your classroom using this earth science unit. Focusing on developing young scientists' spacial thinking skills, these lessons engage...
Curated OER
Annotating Change in Satellite Images
Students construct a movie using Landsat images to observe changes over time on Earth. In this satellite images lesson, students observe changes in land use over time and document one type of change they observe. They produce an...
International Technology Education Association
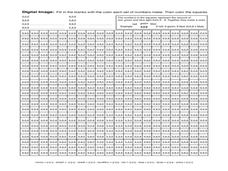
Pixel This!
Did the image I drew match the image you saw? By simulating a satellite and a ground station, teams of two transmit data in the form of pixels in order to recreate an image. They use four different levels of brightness, creating slightly...
Curated OER
Air Pollution: What's the Solution?
This air pollution worksheet provides a step-by-step process for gathering data about the ozone and weather. Amateur meteorologists enter data for 3 days including the air quality, the temperature, the wind speed, any particular events...
Curated OER
Reading Satellite Images
Students analyze satellite images. In this astronomy lesson, students examine 3 satellite images in order to understand how satellite images are taken and what they can teach scientists.
NOAA
What Little Herc Saw
See the underwater world through a different pair of eyes! Middle school marine biologists identify deep-sea organisms by examining images taken by an ROV from the Okeanos Explorer. After determining what creatures lie beneath the...
Curated OER
A Comparison Study of Water Vapor Data to Precipitation over North America
Students use NASA satellite data to compare water vapor over the United States. In this data analysis lesson students use an Excel spreadsheet to map their data.
Curated OER
Images of the Parks
Students explore U.S. geography by completing a research project about the National Parks. In this scenery image analysis lesson, students identify the different national parks in our country and observe paintings and images by famous...
Curated OER
Correcting Bad Data Using Parity Bits
In this parity bits worksheet, students read about pixels and data strings. Students are given 2 data strings that are corrupted by cosmic ray glitches and they identify the bad data and create a valid data string.
Curated OER
Imagers: The Adventure of Echo the Bat Number to Pictures: How Satellite Images are Created
Young scholars examine the three primary colors of light and design a numerical code to represent those colors. They tell how satellites use numbers to create satellite images after completing a number of experimental activities.
Space Awareness
A View From Above
Analyzing and interpreting satellite data takes knowledge and patience. Through a detailed lab investigation, young scholars learn the process of analyzing this data. They use technology to create color images and maps from real...
NOAA
History's Thermometers
How is sea coral like a thermometer? Part three of a six-part series from NOAA describes how oceanographers can use coral growth to estimate water temperature over time. Life science pupils manipulate data to determine the age of corals...
DocsTeach
Patent Analysis: Wright Brothers' Flying Machine
Ideas take flight in an exciting activity exploring the Wright Brothers. Scholars view the Wright Brothers' patent for their flying machine and makes educated guesses as to the purpose of the document. Scholars discuss the purpose of...
Virginia Department of Education
Weather Patterns and Seasonal Changes
Get your class outside to observe their surroundings with a lesson highlighting weather patterns and seasonal changes. First, learners take a weather walk to survey how the weather affects animals, people, plants, and trees during...
NOAA
Investigating Sea Level Using Real Data
The news reports on rising sea level, but how do scientists measure this rise? Scholars use NOAA data including maps, apps, and images to work through five levels of activities related to sea level. Each level in the series adds a new...


