California Academy of Science
California's Climate
The United States is a large country with many different climates. Graph and analyze temperature and rainfall data for Sacramento and Washington DC as you teach your class about the characteristics of Mediterranean climates. Discuss the...
Noyce Foundation
Granny’s Balloon Trip
Take flight with a fun activity focused on graphing data on a coordinate plane. As learners study the data for Granny's hot-air balloon trip, including the time of day and the distance of the balloon from the ground, they practice...
Curated OER
Graph It!
There is more than one way to represent data! Learners explore ways to represent data. They examine stacked graphs, histograms, and line plots. They conduct surveys and use stacked graphs, histograms, or line plots to chart the data they...
Curated OER
Reading Graphs
Working independently or in teams, your class practices connecting graphs, formulas and words. This activity includes a guided discussion about distance vs. time graphs and looking at how velocity changes over time.
Illustrative Mathematics
Favorite Ice Cream Flavor
What better way to engage children in a math instructional activity than by talking about ice cream? Using a pocket chart or piece of chart paper, the class works together creating a bar graph of the their favorite ice cream flavors....
Curated OER
Using Bar Graphs
What's your favorite pizza topping? Scholars analyze two bar graphs, one depicting a math club's favorite pizza toppings and the other ice cream sales per flavor. As they examine the graphs, learners answer a few comprehension questions....
World Wildlife Fund
Bar Charts & Pie Charts
Learn about life in the Arctic while practicing how to graph and interpret data with this interdisciplinary lesson. Starting with a whole group data-gathering exercise, students are then given a worksheet on which they analyze and create...
EngageNY
Transforming the Graph of the Sine Function
Build a solid understanding of trigonometric transformations through exploration. Learners work in teams to analyze the effects of different algebraic components on the graph of a sine function.
Curated OER
Bar Graphs
What are these bar graphs depicting? Novice data analyzers examine two basic bar graphs and answer three comprehension questions about each. The first graph shows tickets sold per date and the next is distances run per member of a cross...
Curated OER
Graphs
For beginners to picture graphs this is the perfect resource. They analyze two bar graphs that break down data visually so scholars can actually count the number in each column. For the first, they fill in how many of each type of pet is...
Curated OER
Bar Graphs
Introduce scholars to bar graphs and data analysis through analyzing these visual examples. First, they look at a pictograph of fruit types and answer five observation questions. There is one done for them as an example. Learners do the...
Curated OER
Exploring Quadratic Data : Transformation Graphing
High schoolers analyze the vertex form of a parabola and find an approximate fit of a model. They explain the quadratic parabola function and its properties by developing quadratic models. They use translation and dilation to change the...
National Security Agency
Going Green with Graphs
In this unit designed for second graders, youngsters are introduced to conducting surveys and creating tally charts based on the data they gather. Students then construct bar graphs, and observe the relationships between the two types of...
Willow Tree
Line Graphs
Some data just doesn't follow a straight path. Learners use line graphs to represent data that changes over time. They use the graphs to analyze the data and make conclusions.
CCSS Math Activities
Smarter Balanced Sample Items: 8th Grade Math – Target D
Can learners determine solutions associated with lines? A slide presentation contains sample items for the Smarter Balanced 8th grade math Target D covering solving linear equations and systems of linear equations. Items illustrate the...
CCSS Math Activities
Smarter Balanced Sample Items: 6th Grade Math – Target G
Making money and saving money turn into high interest topics for sixth graders. Grade 6 Claim 1 Item Slide Shows use these topics in a presentation with math practice problems. The questions require applying knowledge of algebraic...
Curated OER
Math: Navigating the World Around Me
Young mathematicians research and discuss real world math word problems and ways in which they apply math concepts in their everyday lives. They create a storyboard of a math word problem from which they create a slide for a multi-media...
EngageNY
Analyzing a Graph
Collaborative groups utilize their knowledge of parent functions and transformations to determine the equations associated with graphs. The graph is then related to the scenario it represents.
Flipped Math
Modeling with Graphs
Create a graph for anything in the world. Pupils continue to work with graphs that model situations. The learners analyze different graphs to answer questions about the scenario along with finding equations of graphs. Scholars use...
CK-12 Foundation
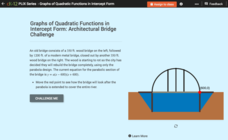
Graphs of Quadratic Functions in Intercept Form: Architectural Bridge Challenge
There are architectural parabolas all around us! A creative lesson analyzes the architecture of a parabolic bridge. Learners must manipulate the bridge to satisfy given criteria and then answer questions about the dimensions of the...
Curated OER
Analyzing Graphs
In this statistics and probability worksheet, students analyze frequency distribution tables or histograms and box and whisker plots. The two page worksheet contains four multiple choice questions. Answers are included.
Curated OER
Generate Measurement Data Word Problems
Bar and line graphs are an excellent way to visually analyze data: give your scholars practice both analyzing graphs and creating their own! First, they examine five basic bar graphs, indicating the number of squares on specific days....
Curated OER
Exercise Set 2.7: Functions and Graphs
In this functions worksheet, students solve 40 short answer problems. Students determine if a graph represents a function. Students find the domain of absolute value and square root functions.
Curriculum Corner
7th Grade Math "I Can" Statement Posters
Translate the Common Core math standards into a series of achievable "I can" statements with this collection of classroom displays. Offering posters for each standard, this resource is a great way to support your seventh graders as they...


