US Department of Commerce
Featured Activity: How the Census Impacts My Community
Individuals have $50,000 to spend on a program at their schools—what will they do with the money? After looking at the Constitutional mandate, learners use a census simulation activity to consider the question. After conducting their own...
US Department of Commerce
Census in Counties - Describing and Comparing Histograms to Understand American Life
Use graphs to interpret life in 136 counties. Pupils analyze histograms and describe the shapes of the distributions of data collected from several counties on different aspects of life. Scholars make predictions on the difference in...
US Department of Commerce
Over the Hill - Aging on a Normal Curve
Nobody is too old to learn something new. Young statisticians analyze census data on the percentage of the population older than 65 years old in US counties. They fit a normal distribution to the data, determine the mean and standard...
US Department of Commerce
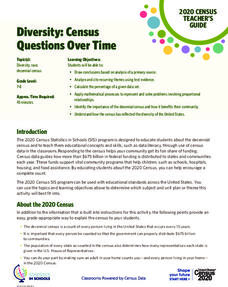
Diversity: Census Questions Over Time
The story of race in the United States continues to evolve, and the numbers show it. Using data from the last two census counts, learners consider recent demographic shifts. They then analyze the information to hypothesize: What could...
US Department of Commerce
Featured Activity: Population Change Over Time
Keep track of a state's population. After a brief discussion on how population data is used for funding, individuals look at population changes over time. Pupils find the population of two states using three different censuses. They then...
US Department of Commerce
Commuting to Work: Box Plots, Central Tendency, Outliers
Biking may be an outlier. Using data from 10 states on the number of people reporting they bike to work, pupils calculate the measures of center. Scholars determine the range and interquartile range and find which provides a better...
US Department of Commerce
Immigration Nation
People come and people go. Given tabular census data on the annual number of immigrants from four different regions of the world between 2000 and 2010, pupils create double bar graphs and line graphs from the data. They analyze their...
US Department of Commerce
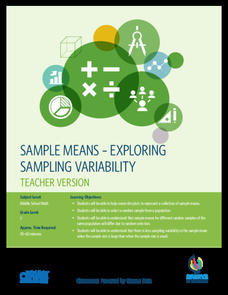
Sample Means - Exploring Sampling Variability
Sample an excellent resource on sampling variability. Pupils analyze census data on the percentage of homes in each state that have Internet access. They take random samples of different sample sizes, determine the sample means, and then...
US Department of Commerce
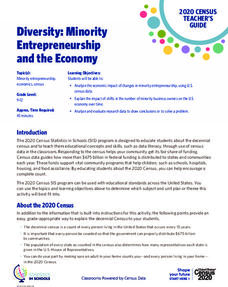
Diversity: Minority Entrepreneurship and the Economy
Using data from the Census Bureau, learners discover the growth in minority-owned businesses over time. After crunching numbers, analytical questions probe the reasons behind the shift.
US Department of Commerce
Applying Correlation Coefficients - Educational Attainment and Unemployment
Correlate education with unemployment rates. Individuals compare state and regional unemployment rates with education levels by calculating the correlation coefficient and analyzing scatter plots. Pupils begin by looking at regional data...
US Department of Commerce
The New Normal
Don't be normal ... be exceptional in understanding statistics. Pupils analyze six different sets of census data using histograms or normal probability plots to determine whether each data set fits a normal distribution. They then get...
US Department of Commerce
My Dream Home
Dream big or go home. After analyzing a bar graph on the number of bedrooms in US homes derived from census data, scholars design their own dream homes. They cut out two-dimensional shapes from construction paper to create models of...
Illustrative Mathematics
Electoral College
A cross-curricular resource that takes the electoral votes and allows your learners to organize and analyze the data. Young voters can determine which states are more influential and interpret the dotplot provided for more data....
Curated OER
US Population 1982-1988
Your algebra learners make predictions using the concepts of a linear model from real-life data given in table form. Learners analyze and discuss solutions without having to write a linear equation.
US Department of Commerce
Exploring Sampling Variability - Higher Education Attainment Across The United States
More education in statistics is always beneficial. Given cards that provide the proportion of adults with bachelor's degrees in 10 random US states, scholars individually determine the sample percentage of states in which more than 30...
US Census Bureau
U.s. Census Bureau: Measuring 50 Years of Economic Change [Pdf]
A lengthy report published in 1998 that analyzes historical changes in the US economy and labor force, based on data collected by the Census Bureau.
University of Regina (Canada)
University of Regina: Math Central: Bias or No Bias?
Students analyze the types of biases in surveys and how they affect the outcomes. A downloadable version of the activity and a survey activity are included. This lesson is from a group of lessons that uses "Census at School" data.


![U.s. Census Bureau: Measuring 50 Years of Economic Change [Pdf] Activity U.s. Census Bureau: Measuring 50 Years of Economic Change [Pdf] Activity](https://d15y2dacu3jp90.cloudfront.net/images/attachment_defaults/resource/large/FPO-knovation.png)
