College Board
2004 AP® Psychology Free-Response Questions
Time influences mental health and behavior, but how? Learners explore the topic with authentic College Board materials. Using another scenario, scholars consider the various research methods used to explore the connection between stress...
College Board
2003 AP® Psychology Free-Response Questions
Intelligence testing can be a useful tool—but what are its limits? Scholars explore the question, considering issues such as the role of bias, using authentic College Board materials. Learners also examine the psychological factors...
College Board
2011 AP® Psychology Free-Response Questions
A student is taking her first exam in Japanese. What are some factors that could affect her success? Learners consider the question, as well as examine a study on vision and feedback using authentic College Board materials.
PHET
Plinko Probability
It's a good thing the resource dropped into your radar. Young mathematicians use an app that randomly drops balls through a Plinko game and into bins. They compare the distribution to that of an ideal binomial distribution.
Pace University
Grades 7-8 Mean, Median, and Mode
Take a central look at data. The differentiated instructional activity provides activities for pupils to calculate central tendencies. Scholars begin choosing three central tendency activities from a Tic-Tac-Toe board. Learners then...
Radford University
Are Kitchen Cabinets at the Correct Height? Lesson 6
Don't hit your head on the kitchen cabinet. Using previously collected female height data, scholars apply confidence intervals and tests of significance to perform a data analysis. They connect the data to the height
of kitchen cabinets...
Radford University
Are Kitchen Cabinets at the Correct Height? Lessons 1-5
Here's a not-so-normal unit on normal heights. Future statisticians anonymously collect class data on female heights, weights, and shoe sizes. They then analyze the data using normal distributions, z-scores, percentiles, and the...
Radford University
Budgeting Your Time and Money
Use mathematics to better manage money. Pupils learn about budgets and personal finance with a set of three lessons. They research salary data for their chosen careers, look up various costs of living to develop budgets, and plan an...
Radford University
Let's Buy a Car
Ready to buy a car? Learners research different makes and models of cars to decide on the best one to buy. They collect data on cost, fuel efficiency, safety ratings, and insurance costs, then create and analyze data displays to make...
Radford University
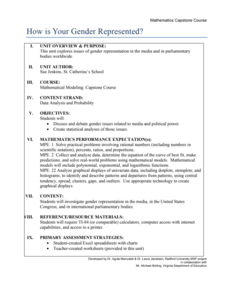
How Is Your Gender Represented?
Does the media shape people's views on gender? Scholars use data on gender portrayal in magazines to explore the idea. They use a spreadsheet program to create bar graphs and perform a chi-square test. They also use provided data to...
World History Digital Education Foundation, Inc.
COVID-19: Geographic Diffusion
An intriguing instructional activity provides information to help academics understand the role of geography in the diffusion of the COVID-19 illness. Academics interpret charts and make predictions for the future. The timely resource...
Radford University
Data Analysis Activity
What do classmates think? In groups, learners design surveys to investigate chosen topics. They conduct the survey, then analyze the results. As part of the activity, they must calculate the mean, median, mode, variance, and standard...
US Department of Commerce
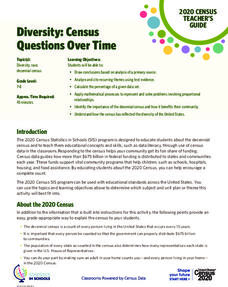
Diversity: Census Questions Over Time
The story of race in the United States continues to evolve, and the numbers show it. Using data from the last two census counts, learners consider recent demographic shifts. They then analyze the information to hypothesize: What could...
NASA
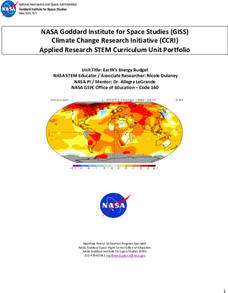
Earth’s Energy Budget
Take the time and energy learn about Earth's energy budget. An engaging unit of four lessons focuses on the components that make up Earth's energy budget. Future scientists come up with a formula for the energy budget, then use software...
American Statistical Association
How Long Are the Words in the Gettysburg Address?
It's 268 words, but one only needs to consider 10 of them at a time. A data collection and analysis activity has learners investigate the lengths of words in the Gettysburg Address. They first self-select a sample of 10 words and...
American Statistical Association
A Tale of One City and Two Lead Measurements
Lead the way in learning about lead contamination. Pupils first read several articles about the Flint water crisis and the EPA's rules for lead concentration. They use provided data from 71 Flint water wells to compute the 90th...
Curated OER
Border Math
Learners examine and interpret data relating to U.S.-Mexico borderland realities, and consider such aspects of social science as the study of population, crime, government spending, pollution, health, and economics.
Curated OER
How Are Students Doing on the AP exams?
Students compile and analyze data pertaining to College Credit AP Exams. They pose questions - Which exam is the easiest? - determine answers from their data and display their results.
Curated OER
Checking County Numbers
Students use their county's information page to gather information about their community. Using the information, they create graphs from the tables provided and interpret the data. They write a paragraph showing their interpretation of...
Curated OER
The Guise of a Graph Gumshoe
Eighth graders practice constructing bar, circle, and box-and-whisker graphs. They practice reading and interpreting data displays and explore how different displays of data can lead to different interpretations.
Curated OER
Basketball And Mathematics
Eighth graders collect and analyze data about foul shots taken at basketball games.
Curated OER
Code Breakers
Students collect data and make a frequency table, change ratios into percents, and analyze data to make predictions.
Curated OER
Picture a Nation
Students research immigration data from a specific time period. They create a graphic organizer that depicts the information and share the information with the class.
Curated OER
The Car Pool is Coming
Students evaluate the number of people who travel out of their town to work. They figure out what the percentage of each town's commuting workers is to the number who commute in the region. They plot the percentages on a pie chart.
Other popular searches
- Data, Census, & Statistics
- Probability and Statistics
- Educational Statistics
- Baseball Statistics
- Math Statistics
- Climate Statistics
- Math Lessons Statistics
- Median and Mean Statistics
- Statistics Lesson Plans
- Sports and Statistics
- Probability Statistics
- Black Plague Statistics


