National Research Center for Career and Technical Education
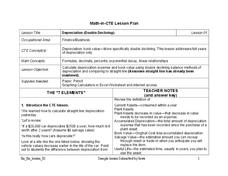
Depreciation (Double Declining)
Have you ever been told that your new car begins to lose its value as soon as you drive it off the lot? Aspiring accountants take on the concepts of depreciation and book value through an easy-to-deliver career and technology lesson...
Teach Engineering
Watt Meters to Measure Energy Consumption
It used watt amount of energy? This resource investigates the power usage of small household appliances. Using a watt meter, groups measure the actual wattage used by an appliance and then calculate the energy used daily.
NASA
Launch Altitude Tracker
Using PVC pipe and aquarium tubing, build an altitude tracker. Pupils then use the altitude tracker, along with a tangent table, to calculate the altitude of a launched rocket using the included data collection sheet.
Virginia Department of Education
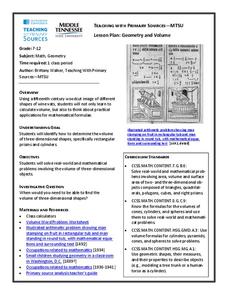
Geometry and Volume
The history of math is fascinating! Utilize a woodcut primary source image from 1492 and posters from the 1930s to help geometers apply their volume-calculation skills to real-life questions.
Centre for Innovation in Mamatics Teaching
Area, Perimeter and Volume
Develop young mathematicians' knowledge of two- and three-dimensional shapes with this geometry workbook. From learning about the classifications of different shapes and figures to calculating their area, perimeter, and volume, this...
Curated OER
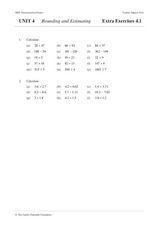
Rounding and Estimating before calculating with a Calculator
In this rounding worksheet, students solve six problem sets concerned with rounding and estimating. Students first estimate what the answer should be and then carry out the calculations using a calculator. Solutions are provided.
Curated OER
Calculator Activity: Time Flies
In this skip count worksheet, students use a calculator to help them skip count starting with the given time and finishing 60 minutes later.
Curated OER
Probability Experiment Simulation: Design and Data Analysis Using a Graphing Calculator
Seventh graders simulate probability experiments. Using a graphing calculator, 7th graders design, conduct, and draw conclusions from simulations or probability experiments. Students construct frequency tables and compare the...
Curated OER
Graphing Calculator Activity: Multiplying and Dividing Mixed Numbers
In this graphing calculator worksheet, students explore necessary steps to multiply and divide mixed numbers using a graphing calculator. In groups, students measure objects in their classroom and write equations using their collected...
Curated OER
Calculators
Students investigate the four basic operations of mathematics that are addition, subtraction, multiplication, and division. The use of a technology game is part of the instructional activity. They demonstrate the proper use of a...
Curated OER
Calculate Time Intervals
For this time intervals worksheet, students look at and calculate time intervals. Students are given ten problems with two times. Students are to determine how much time has elapsed between the two times.
Curated OER
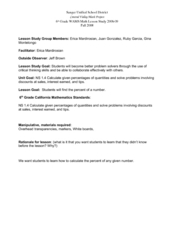
Calculate Percentages
Sixth and seventh graders study the concept of finding the percent of a number. They calculate the percent of any given number. Pupils describe ways to use calculating percents in their daily life, and change percents into decimals,...
Curated OER
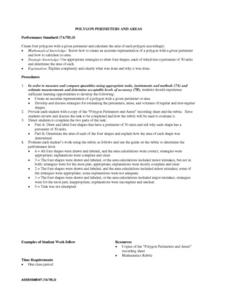
Calculating Perimeter and Area of Polygons
Students discuss strategies for estimating information about various shapes. Once they draw and label four shapes with perimeters of 30 units, they calculate the areas of the figures. To complete the lesson, students offer written...
Curated OER
Broken Calculator Task 2
Start a class discussion around problem solving. This super short, simple presentation, tells children that their calculator is broken, then asks them to solve a single subtraction problem. They solve the problem and discuss the...
Curated OER
Non Calculator Math Quiz
Here is a quiz which does not allow calculators. Kids solve a variety of problems that range from addition and subtraction of decimal numbers to probability and perimeter. There are 24 problems to solve. As stated on the resource, this...
Curated OER
Reverse Percentages
In this percentages worksheet, young scholars use a calculator to find the original number in reverse percentages problems. Students complete 7 problems total.
Statistics Education Web
It Creeps. It Crawls. Watch Out For The Blob!
How do you find the area of an irregular shape? Class members calculate the area of an irregular shape by finding the area of a random sampling of the shape. Individuals then utilize a confidence interval to improve accuracy and use a...
Illustrative Mathematics
Solar Eclipse
Learners take on the role of astronomers, calculating conditions necessary for a total solar eclipse. Concepts of similar triangles and properties of circles come together as pupils create ratios and use real measurements in determining...
Math Worksheets Land
Zombie's Mean, Median, Mode, and Range
Given four sets of data, zombie-loving mathematicians find the mode, range, mean, and median for each set. The sheet is more challenging if calculators are not used; but the data set with large numbers may require a calculator.
US Department of Commerce
Applying Correlation Coefficients - Educational Attainment and Unemployment
Correlate education with unemployment rates. Individuals compare state and regional unemployment rates with education levels by calculating the correlation coefficient and analyzing scatter plots. Pupils begin by looking at regional data...
Flipped Math
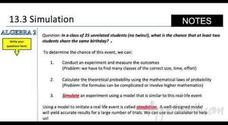
Simulations
Simulate an exciting graphing calculator-based lesson. Individuals watch and participate creating simulations using the random number generator in a graphing calculator to answer probability problems. Learners then build simulations to...
Teach Engineering
Graphing Equations on the Cartesian Plane: Slope
Slopes are not just for skiing. Instructors introduce class members to the concept of slope and teach them how to calculate the slope from a graph or from points. The lesson also includes the discussion of slopes of parallel and...
CK-12 Foundation
Expected Value: Game of Chance
Determine whether the payoff is worth it. Pupils calculate the expected value of a game with three different payoff levels. Each level has a different probability of winning money. The scholars find the expected payoffs for each level...
National Council of Teachers of Mathematics
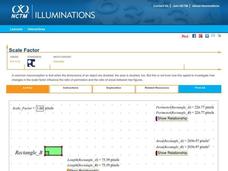
Scale Factor
Does doubling mean everything doubles? Learners adjust the scale factor between two rectangles. Using the calculated measurements, pupils investigate the ratios between the lengths, perimeters, and areas of the rectangles.
Other popular searches
- Calculator Skills
- Ti 83 Graphing Calculator
- Using a Calculator
- Calculator Activities
- Calculator Math
- Calculator Math Games
- Graphing Calculators
- Algebra Graphing Calculator
- Calculator Lessons
- Computer Calculator
- Ti Explorer Calculator
- Graphing Calculator Activity


