EngageNY
Solution Sets for Equations and Inequalities
How many ways can you represent solutions to an equation? Guide your class through the process of solving equations and representing solutions. Solutions are described in words, as a solution set, and graphed on a number line....
EngageNY
Graphs of Exponential Functions and Logarithmic Functions
Graphing by hand does have its advantages. The 19th installment of a 35-part module prompts pupils to use skills from previous lessons to graph exponential and logarithmic functions. They reflect each function type over a diagonal line...
EngageNY
Bean Counting
Why do I have to do bean counting if I'm not going to become an accountant? The 24th installment of a 35-part module has the class conducting experiments using beans to collect data. Learners use exponential functions to model this...
EngageNY
Wishful Thinking—Does Linearity Hold? (Part 2)
Trying to find a linear transformation is like finding a needle in a haystack. The second lesson in the series of 32 continues to explore the concept of linearity started in the first lesson. The class explores trigonometric, rational,...
EngageNY
Revisiting the Graphs of the Trigonometric Functions
Use the graphs of the trigonometric functions to set the stage to inverse functions. The instructional activity reviews the graphs of the basic trigonometric functions and their transformations. Pupils use their knowledge of graphing...
EngageNY
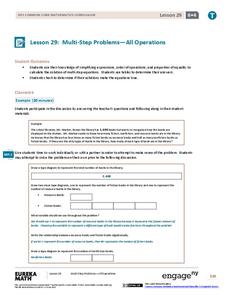
Multi-Step Problems—All Operations
Harness the power of algebra to solve problems. Young mathematicians learn to work out multi-step problems by applying algebraic techniques, such as solving equations and proportions. They use tape diagrams to model the problem to finish...
Missouri Department of Elementary
Fatal Accident
While there may not be any ghostbusters in the neighborhood, there are plenty of emergency response agencies ready to give support if something is amiss. To that end, instructors invite a member of an emergency response agency to address...
EngageNY
Ptolemy's Theorem
Everyone's heard of Pythagoras, but who's Ptolemy? Learners test Ptolemy's Theorem using a specific cyclic quadrilateral and a ruler in the 22nd installment of a 23-part module. They then work through a proof of the theorem.
Curated OER
Brian's Pegboard II
Young scholars are able to assess a problem and use systematic methods to solve the problem. They also find out all the possible outcomes for a sequence of events using tree diagrams.
Curated OER
ndirect Measurement Technique: Using Trigonometric Ratios
Ninth graders find the height of an object that would be difficult or impossible to measure directly. They construct and use a Clinometer to measure the angle of elevation (or depression). Students create a sketch of the measurement...
Curated OER
Square and Triangular Numbers
Young scholars use equations to represent practical situations. They solve linear equations and quadratic equations. The use of problem solving strategies is also developed.
Curated OER
Exploring Similarity Using Scale Drawings
Learners explore scale factor as they create a scale drawing of a box, then determine the surface area and volume of the original and the scale drawing. The one page worksheet contains activities and procedures with four questions....
Curated OER
Congruent Triangles - Is This Enough Information?
Seventh graders examine congruence postulates and apply knowledge to triangles in the world around them.
Curated OER
Color Dots 2
Students develop simple observations. They observe bleeding of colored inks with water, to understand mixtures, and to make generalized inferences from their observations.
Curated OER
Follow Those Tracks
Students observe a picture containing patterns of animal tracks, infer what might have happened based upon the pattern of tracks, and write a story describing what might have happened.
Shodor Education Foundation
Sets and the Venn Diagram (Beginner)
Venn diagrams are helpful in understanding the idea of a set and using attributes to sort items. This basic plan is an introduction with an added bonus of an applet that can be used to demonstrate the activity. If a classroom of...
Curated OER
Identifying Creatures
Students use a classification key from a provided worksheet to identify creatures. This task assesses student's abilities to interpret data, make decisions, identify, and classify.
Curated OER
Colored Dots 1
Learners observe that colored markers are a mixture of many different colors by performing a chromatography experiment. They make observations, record information, and make generalized inferences from their observations.
Curated OER
Packing Materials
Students observe the effects of water on four different packing materials to determine which ones are more soluble. They then decide which material would be a good packing material to use for the environment and which may be a bad...
Curated OER
Plastic Wrap
Students compare the price and quality of different kinds of plastic kitchen wraps and then rank them from best to worst. They take into account how well it comes out of the roll, if it seals well, it is tangles, how much weight it...
Curated OER
More Lizard Snacks
Students listen to Chapter I, Chapter II, Chapter III, and Chapter IV of "The Forgetful Pony". They observe different stages of development of mealworms. The student sequences pictures to show the life cycle and draws the developmental...
Curated OER
Shapely Figures
Students are given magazines, scissors, glue, and one sheet of construction paper. They look for pictures showing real life representations of rectangular prisms, spheres, cones, and pyramids. Pupils cut out pictures showing each of...
Ahisma Summer Institute
The Power of One - Math in a Different Angle
In this 2-day lesson focused on exponents, middle schoolers will cross the curriculum by engaging in science, history and language arts activities. Exponential growth will be explored using grains of rice on a chess board. Exponential...
Mascil Project
Sports Physiology and Statistics
If I want to build up my heart, where should I start? Science scholars use statistics in a sports physiology setting during an insightful experiment. Groups measure resting and active heart rates and develop a scatter plot that shows the...


