EngageNY
Events and Venn Diagrams
Time for statistics and learning to overlap! Learners examine Venn Diagrams as a means to organize data. They then use the diagrams to calculate simple and compound probabilities.
Illustrative Mathematics
Multiples of Nine
Which numbers are multiples of 9? Task class members to find the first ten multiples of 9 in a straightforward assessment worksheet.
Earth Watch Institute
Entering Local Groundhog Data in an Excel Spreadsheet
Here is a cross-curricular ecology and technology lesson; your learners create spreadsheets depicting the location and number of groundhog dens in a local park. They research groundhogs and analyze data about where the groundhog...
Illustrative Mathematics
Traffic Jam
Help your learners understand dividing with fractions by using these methods to solve. Chose from two different number lines or linker cubes. This practices "how many groups?" style division problems which help them comprehend why they...
Curated OER
Rounding and Subtracting
Common Core is all about getting your learners to open their minds and think about the why and how. This problem has them thinking about unknown numbers and their relationship with one another when we round and subtract. They will have...
Curated OER
College Athletes
When more basketball players are taller than field hockey players at a school, is it safe to say that in general they are always taller? The activity takes data from two college teams and your learners will be able to answer questions...
Mathematics Vision Project
Probability
Probability, especially conditional probability, can be a slippery concept for young statisticians. Statements that seem self-evident on the surface often require a daunting amount of calculations to explicate, or turn out to be not so...
Mathematics Assessment Project
Octagon Tile
A connecting-the-dots activity seems too easy for seventh grade but connecting vertices may prove a challenge. Class members first examine a figure created by drawing squares around the inside of an octagon and connecting the vertices....
Willow Tree
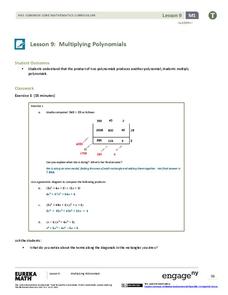
Multiplying Polynomials
Make two parts into a whole. Scholars learn to multiply polynomials to create a simplified polynomial expression. Polynomials include monomial, binomials, and trinomials.
Willow Tree
Line Plots
You can't see patterns in a jumble of numbers ... so organize them! Learners take a set of data and use a line plot to organize the numbers. From the line plot, they find minimum, maximum, mean, and make other conclusions about the data.
Mathematics Assessment Project
Temple Geometry
Temper your excitement of temple geometry. Using algebraic and geometry concepts to determine various measurements in a circle diagram, scholars determine the shaded area of the diagram.
California Education Partners
T Shirts
Which deal is best? Learners determine which of two companies has the best deal for a particular number of shirts. They begin by creating a table and equations containing each company's pricing structure. Individuals finish the seventh...
CK-12 Foundation
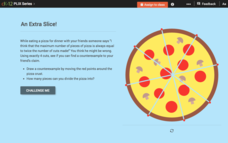
Conjectures and Counterexamples: An Extra Slice!
Class members will eat up an enticing interactive that lets users change the location of cuts made into a pizza to adjust the number of created slices. They create a counterexample for a conjecture on the number of slices.
CCSS Math Activities
Golf Balls
Land on the green with a fun resource. A short performance task asks pupils to consider the volume of containers that hold golf balls. They determine the percentage of empty space of the container for different numbers of golf balls.
California Education Partners
Bake Sale
Work with fractional cookies. The three-part assessment task checks the pupils' ability to find the product of fractions and whole numbers, mixed numbers, or fractions. Learners determine the amount of ingredients needed and how many of...
California Education Partners
Improving Our Schools
Split the work three ways. Learners use their knowledge of fractions to solve problems dealing with splitting up work loads evenly between three groups. Scholars determine the fractional portion of work each group will do along with...
California Education Partners
Soccer Snacks
Make the cookies healthy. The assessment task asks pupils to determine the number of cookies they could make based on a given amount of ingredients. Given two sugar substitutes, learners determine which substitute would be better and...
California Education Partners
John's Trip Disneyland
It all adds up to one. Pupils solve several items that involve finding sums of fractions in relationship to a whole. The assessment task uses fractions with unlike denominators to determine the amount of a tank of gas and the amount of...
EngageNY
Factoring Expressions
Factor in an informative resource when teaching about factoring. The 11th lesson in a 36-part module shows pupils how to factor algebraic expressions by applying the distributive property. Some of the problems involve expressions with...
EngageNY
Increasing and Decreasing Functions 1
Model situations with graphs. In the fourth installment of a 16-part module, scholars learn to qualitatively analyze graphs of piecewise linear functions in context. They learn to sketch graphs for different situations.
Illustrative Mathematics
Making Hot Cocoa, Variation 2
Learners are introduced to dividing by fractions in a visual way. Setting up groups from the information in the problem allows them to see what we divide and why. Use with the previous lesson, which can be found in Additional Materials,...
Hotchalk
Triangle Sum Theorem
Your visual geometry learners will appreciate triangle drawings as they model the triangle sum theorem and algebraically solve to find the missing interior angle in a triangle. Practice problems increase in complexity and vary in their...
Charleston School District
Graphing Functions
How do letters and numbers create a picture? Scholars learn to create input/output tables to graph functions. They graph both linear and nonlinear functions by creating tables and plotting points.
Illustrative Mathematics
Fixing the Furnace
This comprehensive resource applies simultaneous equations to a real-life problem. Though the commentary starts with a graph, some home consumers may choose to begin with a table. A graph does aid learners to visualize the shift of one...


