EngageNY
Representing, Naming, and Evaluating Functions (Part 2)
Notation in mathematics can be intimidating. Use this lesson to expose pupils to the various ways of representing a function and the accompanying notation. The material also addresses the importance of including a domain if necessary....
EngageNY
Tangent Lines and the Tangent Function
Construct tangent lines and make the connection to tangent functions. An informative lesson reviews the geometry origins of the tangent function. Pupils use that information to determine how to construct a tangent to a circle from a...
EngageNY
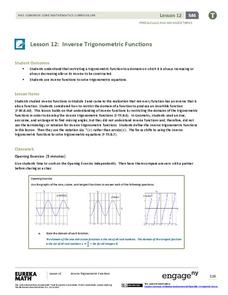
Inverse Trigonometric Functions
Build on the understanding of finding angles using trigonometric ratios. Pupils develop the definitions of inverse trigonometric functions by restricting their domains in the 13th lesson of a 16-part series. They use inverse functional...
EngageNY
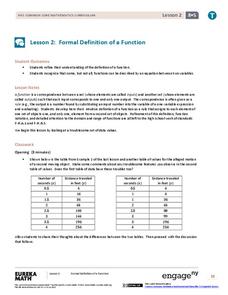
Formal Definition of a Function
Formalize the notion of a function. Scholars continue their exploration of functions in the second lesson of the module. They consider functions as input-output machines and develop function rules for selected functions.
EngageNY
More Examples of Functions
Discrete or not discrete? Individuals learn about the difference between discrete and non-discrete functions in the fourth installment of a 12-part module. They classify some examples of functions as being either discrete or non-discrete.
Mathematics Vision Project
Features of Functions
What are some basic features of functions? By looking at functions in graphs, tables, and equations, pupils compare them and find similarities and differences in general features. They use attributes such as intervals of...
Concord Consortium
Function Project
What if a coordinate plane becomes a slope-intercept plane? What does the graph of a linear function look like? Learners explore these questions by graphing the y-intercept of a linear equation as a function of its slope. The result is a...
Concord Consortium
Rational and Not So Rational Functions
Do not cross the line while graphing. Provided with several coordinate axes along with asymptotes, pupils determine two functions that will fit the given restrictions. Scholars then determine other geometrical relationships of asymptotes...
Concord Consortium
Functions by the Slice
Piece by piece ... dismantling a function can highlight interesting patterns. The task asks learners to slice functions in sections with the same vertical change. They then recreate the graph with these slices positioned horizontally....
Illustrative Mathematics
Identifying Exponential Functions
Class members have the opportunity to quickly change the variables of an exponential graphs through the use of sliders on Desmos. Four graphs are given and young mathematicians, through the use of the graphing app, can discover which...
Curated OER
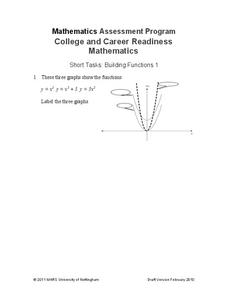
Building Functions
Pupils determine equations that match the graphs of transformations and the parent quadratic function. The resource requires class members to attend to precision and think abstractly.
Inside Mathematics
Functions
A function is like a machine that has an input and an output. Challenge scholars to look at the eight given points and determine the two functions that would fit four of the points each — one is linear and the other non-linear. The...
EngageNY
The Graph of a Function
Mathematics set notation can be represented through a computer program loop. Making the connection to a computer program loop helps pupils see the process that set notation describes. The activity allows for different types domain and...
EngageNY
Graphs of Linear Functions and Rate of Change
Discover an important property of linear functions. Learners use the slope formula to calculate the rates of change of linear functions. They find that linear functions have constant rates of change and use this property to determine if...
EngageNY
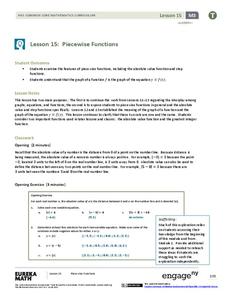
Piecewise Functions
Show your class members that if they can graph a linear function, they can graph an absolute value function. Groups create an absolute value graph using a table, then entertain the idea of an absolute value function defined as two...
EngageNY
Graphs of Simple Nonlinear Functions
Time to move on to nonlinear functions. Scholars create input/output tables and use these to graph simple nonlinear functions. They calculate rates of change to distinguish between linear and nonlinear functions.
EngageNY
Increasing and Decreasing Functions 1
Model situations with graphs. In the fourth installment of a 16-part module, scholars learn to qualitatively analyze graphs of piecewise linear functions in context. They learn to sketch graphs for different situations.
EngageNY
Graphing the Tangent Function
Help learners discover the unique characteristics of the tangent function. Working in teams, pupils create tables of values for different intervals of the tangent function. Through teamwork, they discover the periodicity, frequency, and...
EngageNY
Translating Graphs of Functions
If you know one, you know them all! Parent functions all handle translations the same. This instructional activity examines the quadratic, absolute value, and square root functions. Pupils discover the similarities in the behavior of the...
EngageNY
Stretching and Shrinking Graphs of Functions
Why is that graph wider? Pupils learn about stretching and shrinking graphs of square root, absolute value, cubic, and quadratic functions. They study both vertical and horizontal stretches and shrinks in addition to reflections.
EngageNY
Modeling with Inverse Trigonometric Functions 1
Where should I stand to get the best view? Pupils use inverse trigonometric functions to determine the horizontal distance from an object to get the best view. They round out the lesson by interpreting their answers within context.
EngageNY
Structure in Graphs of Polynomial Functions
Don't allow those polynomial functions to misbehave! Understand the end behavior of a polynomial function based on the degree and leading coefficient. Learners examine the patterns of even and odd degree polynomials and apply them to...
EngageNY
Linear Functions and Proportionality
Connect linear equations, proportionality, and constant rates of change to linear functions. Young mathematicians learn how linear equations of the form y = mx + b can represent linear functions. They then explore examples of linear...
EngageNY
Transforming the Graph of the Sine Function
Build a solid understanding of trigonometric transformations through exploration. Learners work in teams to analyze the effects of different algebraic components on the graph of a sine function.


