Inside Mathematics
Graphs (2006)
When told to describe a line, do your pupils list its color, length, and which side is high or low? Use a worksheet that engages scholars to properly label line graphs. It then requests two applied reasoning answers.
Common Core Sheets
Determining Coordinates: Graphing Patterns
Building on their prior knowledge about patterns, this series of worksheets introduces young mathematicians to graphing in the coordinate plane. Using written descriptions of different numerical patterns, learners...
Flipped Math
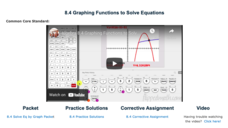
Graphing Functions to Solve Equations
Intersections become solutions. Scholars watch a video on using a graphing calculator to find the solution to an equation in one variable. While watching the presentation, pupils practice working some of the examples and compare their...
Regional Professional Development
Solving Systems of Equations by Graphing
With 30 problems, each accompanied by a blank graph, pupils get thorough practice solving systems of equations by graphing and finding the point of intersection. Answers are provided in coordinate form.
EngageNY
Interpreting Graphs of Proportional Relationships
What do those points on the graph mean? The 10th instructional activity in a series of 22 presents proportional relationships as graphs. Class members interpret various points of the graph — including the origin — within the context of...
Math Drills
Thanksgiving Cartesian Art: Mayflower
How did the Pilgrims arrive to America? Middle schoolers graph ordered pairs on a coordinate system, connect the points, and discover a mystery picture—the Mayflower.
CK-12 Foundation
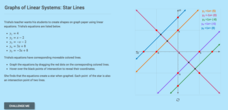
Graphs of Linear Systems: Star Lines
Let the class stars shine. Using four given linear equations, scholars create a graph of a star. The pupils use the interactive to graph the linear systems and determine the points of intersection. Through the activity, classmates...
PBS
Working with Coordinate Planes: Activities and Supplemental Materials
Seven activities make up a collection of supplemental materials to reinforce graphing on a coordinate plane. Worksheet objectives include plotting coordinates within single and four quadrants, measuring straight and...
EngageNY
The Graph of a Linear Equation in Two Variables Is a Line
Show your class that linear equations produce graphs of lines. The 20th segment in a unit of 33 provides proof that the graph of a two-variable linear equation is a line. Scholars graph linear equations using two points, either from...
Ohio Literacy Resource Center
Solving Systems of Linear Equations Graphing
Do you need to graph lines to see the point? A thorough lesson plan provides comprehensive instruction focused on solving systems of equations by graphing. Resources include guided practice worksheet, skill practice worksheet,...
West Contra Costa Unified School District
Point-Slope Application Problems
Create a linear equation for a problem when the intercept information is not given. The two-day lesson introduces the class to the point-slope form, which can be used for problems when the initial conditions are not provided. Pupils...
West Contra Costa Unified School District
Key Features of Graphs
The key is ... After a day of instruction on key features of graphs, groups create a poster and presentation on the key features of their given function graph. The resource provides an extension activity of "telephone" using...
K20 LEARN
Whoopsies, Graphing Edition: Coordinate Plane Graphing
How do you handle common mistakes in your classroom? A graphing activity prepares scholars to recognize common misconceptions when graphing ordered pairs. The activity concentrates on three common graphing mistakes.
Houston Area Calculus Teachers
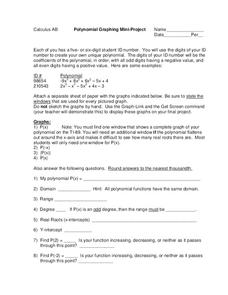
Polynomial Graphing
Your AP Calculus learners probably have their ID numbers memorized, but have they tried graphing them? Pique your pupils' interest by asking each to create a unique polynomial function based on their ID numbers, and then analyze the...
CK-12 Foundation
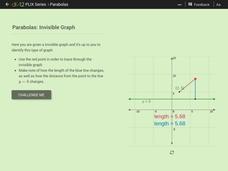
Parabolas: Invisible Graph
Envision the function as the point swings. Given a point connected to another point and a line, pupils trace through an invisible graph. Learners identify the name of the given point and the line and determine the type of conic section...
EngageNY
Identifying Proportional and Non-Proportional Relationships in Graphs
Graph a relationship to find out if it is proportional. The instructional activity introduces the criteria for determining whether a relationship is a proportional relationship based on its graph. Pupils graph relationships and determine...
Computer Science Unplugged
The Poor Cartographer—Graph Coloring
Color the town red. Demonstrate the concept of graph theory with a task that involves determining the least number of colors needed to color a map so that neighboring countries are not represented by the same color. Pupils...
EngageNY
Identifying Proportional and Non-Proportional Relationships in Graphs 2
Work together to find proportional relationships. The sixth portion of the 22-part unit is a collaborative exercise. Teams work with given representations of relationships and determine if they are proportional by creating tables and...
Mt. San Antonio Collage
Test 1: Functions and Their Graphs
Save the time creating an assessment because these function problems should do the trick. With 10 multi-part questions, they each focus on a different topic including radical, polynomial, linear and piecewise functions. The majority of...
Mathematics Vision Project
Module 7: Connecting Algebra and Geometry
The coordinate plane links key geometry and algebra concepts in this approachable but rigorous unit. The class starts by developing the distance formula from the Pythagorean Theorem, then moves to applications of slope. Activities...
Shodor Education Foundation
Graphit
No graphing calculator? No worries, there's an app for that! Young mathematicians use an app to graph functions. In addition, they can also plot data points.
Mathematics Assessment Project
Representing Quadratic Functions Graphically
Sometimes being different is an advantage. An engaging activity has scholars match cards with quadratic functions in various forms. Along the way, they learn about how each form highlights key features of quadratic functions.
Balanced Assessment
Bathtub Graph
Represent the relationship between independent and dependent variables through a modeling situation. The activity expects learners to graph the volume of water in a bathtub during a given scenario. The graph should result in two areas of...
Project Maths
Trigonometric Functions
From a circle to a cycle! The final lesson of a five-part series challenges learners to use points from the unit circle to plot a repeating pattern. The repeating patterns become the graphs of the trigonometric functions. Scholars...


