Willow Tree
Circle Graphs
Pie isn't just for eating! Scholars learn to create pie charts and circle graphs to represent data. Given raw data, learners determine the percent of the whole for each category and then figure out the degree of the circle that percent...
Scholastic
Study Jams! Circle Graph
Over a pizza dinner, RJ and Mia discuss how to use a circle or pie graph to represent data. After viewing, data analysts can use a Test Yourself feature to assess their own understanding. This is ideal for use in a flipped classroom lesson.
CK-12 Foundation
Interpretation of Circle Graphs: Northwest Region Population Pie
Given populations of the five Northwestern states, learners create a circle graph. Using the data and the pie chart, they make comparisons between the populations of the states. Finally, the pupils determine how the chart will change...
Math Worksheets Land
Pie or Circle Graphs Problems - Independent Practice Worksheet
Third graders take a set of data and turn it into a pie graph with an independent activity. Containing 10 sets of data, the resource reinforced data analysis skills that pupils can use throughout a graphing unit.
Math Worksheets Land
Pie or Circle Graphs - Matching Worksheet
It's one thing to be able to read a pie graph, but it's another to analyze a pie graph and match it to its data table. Use a multiple choice worksheet when challenging learners to practice this skill. With six...
Math Mammoth
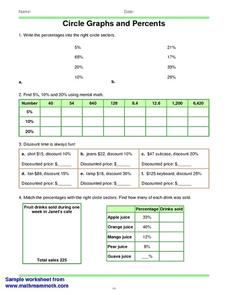
Circles Graphs and Percents
In this percent instructional activity, students read and interpret circle graphs. They determine discounts, and match percentages with circle sectors. This one-page instructional activity contains approximately 30 problems.
World Wildlife Fund
Bar Charts & Pie Charts
Learn about life in the Arctic while practicing how to graph and interpret data with this interdisciplinary lesson plan. Starting with a whole group data-gathering exercise, students are then given a worksheet on which they analyze and...
Math Worksheets Land
Pie or Circle Graphs—Step-by-Step Lesson
How do you display data that you've collected in a pie chart? Follow a clear step-by-step guide to turning survey results into a visible format. It shows kids how to determine the percentage of the whole that each section represents.
CK-12 Foundation
Displaying Categorical Variables: Spending Habits
Bar or circle graph—which is best? Given a circle graph and a total amount of money earned, pupils calculate the amount of money in each category. Learners use the calculated amounts to create a bar graph and compare the two displays.
EngageNY
Graphing the Tangent Function
Help learners discover the unique characteristics of the tangent function. Working in teams, pupils create tables of values for different intervals of the tangent function. Through teamwork, they discover the periodicity, frequency, and...
CK-12 Foundation
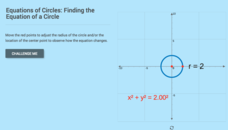
Equations of Circles: Finding the Equation of a Circle
It's all about location and size. With the aid of the interactive, pupils explore the relationship between the location and size of a circle and its equation. The learners use that relationship to determine the equation of a circle given...
Mt. San Antonio Collage
Graphing Trigonometric Functions
Double win with a comprehensive worksheet and an excellent worked out answer key. The worksheet itself is twelve pages and begins with the simple sine and cosine graphs, then, develops into the reciprocal trig functions.
Willow Tree
Bar Graphs
Circles, lines, dots, boxes: graphs come in all shapes in sizes. Scholars learn how to make a bar graph using univariate data. They also analyze data using those bar graphs.
Virginia Department of Education
Graphs
Examine different types of graphs as a means for analyzing data. Math scholars identify the type of graph from a series of data displays and then develop questions to match each one. Then, given a scatter plot of height versus age...
CK-12 Foundation
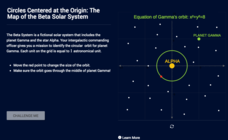
Circles Centered at the Origin: The Map of the Beta Solar System
Calculate galactic orbits in a far-out resource. Pupils drag a point on a circle to graph the orbit of a fictional planet. Using the equation, they find points through which the orbit passes. To finish the simulation, users determine the...
Virginia Department of Education
Circles in the Coordinate Plane
Make the connection between the distance formula and the equation of a circle. The teacher presents a lesson on how to use the distance formula to derive the equation of the circle. Pupils transform circles on the coordinate plane and...
Inside Mathematics
Squares and Circles
It's all about lines when going around. Pupils graph the relationship between the length of a side of a square and its perimeter. Class members explain the origin in context of the side length and perimeter. They compare the graph to the...
EngageNY
Graphing the Sine and Cosine Functions
Doing is more effective than watching. Learners use spaghetti to discover the relationship between the unit circle and the graph of the sine and cosine functions. As they measure lengths on the unit circle and transfer them to a...
Pace University
Grade 7 Earth Day Statistics with Circle and Bar Graphs
Take a tiered approach to studying waste. The lesson uses Earth Day to present differentiated instruction around using circle and bar graphs. Each group gets a cube based on their tiers and works collaboratively as well as individually...
CK-12 Foundation
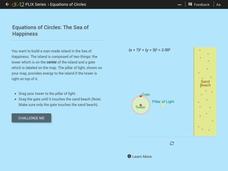
Equations of Circles: The Sea of Happiness
Map this! Help your young mathematicians draw a circular island on a map. Given specifics of the location and size of an island on a map, pupils transform a circle to meet the given requirements. They then determine the location of the...
Project Maths
Trigonometric Functions
From a circle to a cycle! The final lesson of a five-part series challenges learners to use points from the unit circle to plot a repeating pattern. The repeating patterns become the graphs of the trigonometric functions. Scholars...
Willow Tree
Line Graphs
Some data just doesn't follow a straight path. Learners use line graphs to represent data that changes over time. They use the graphs to analyze the data and make conclusions.
Mathematics Vision Project
Circles: A Geometric Perspective
Circles are the foundation of many geometric concepts and extensions - a point that is thoroughly driven home in this extensive unit. Fundamental properties of circles are investigated (including sector area, angle measure, and...
EngageNY
Writing and Graphing Inequalities in Real-World Problems
Inequalities: when one solution just doesn't suffice. Individuals learn to write inequalities in real-world contexts and graph solution sets on the number line. All inequalities in the lesson are of the form x < c or x < c.
Other popular searches
- Percent Circle Graph
- Circle Graph Worksheet
- Circle Graph Template
- Interpreting Circle Graphs
- Circle Graph Protractor
- Circle Graph Activity
- Reading Circle Graphs
- Circle Graphs Pie Charts
- Circle Graph Central Angle
- Bar and Circle Graphs
- Circle Graph in Excel
- Family Budget Circle Graph


