EngageNY
More Practice with Box Plots
Don't just think outside of the box — read outside of it! The 15th lesson in a 22-part unit provides pupils more work with box plots. Learners read the box plots to estimate the five-number summary and interpret it within the context....
EngageNY
Summarizing a Distribution Using a Box Plot
Place the data in a box. Pupils experiment with placing dividers within a data set and discover a need for a systematic method to group the data. The 14th instructional activity in a series of 22 outlines the procedure for making a...
EngageNY
Understanding Box Plots
Scholars apply the concepts of box plots and dot plots to summarize and describe data distributions. They use the data displays to compare sets of data and determine numerical summaries.
US Department of Commerce
Commuting to Work: Box Plots, Central Tendency, Outliers
Biking may be an outlier. Using data from 10 states on the number of people reporting they bike to work, pupils calculate the measures of center. Scholars determine the range and interquartile range and find which provides a better...
Shodor Education Foundation
Box Plot
What information can come from a box? Learners choose a data set to display as a box plot and decide whether to include the median in the calculation of the quartiles, show the outliers, and change the scale. To finish the lesson,...
Mathed Up!
Cumulative Frequency and Box Plots
Learn how to display data. Young data analysts watch a video to review how to create cumulative frequency histograms and box plots. They work on a set of questions to practice producing these data displays.
EngageNY
Comparing Data Distributions
Box in the similarities and differences. The 19th lesson in a unit of 22 presents class members with multiple box plots to compare. Learners use their understanding of five-number summaries and box plots to find similarities and...
Mathematics Assessment Project
Temperatures
As a middle school assessment task, learners first examine line graphs of monthly temperatures for two locations, and then match box plots to each line plot.
Laying the Foundation
Box-and-Whisker Plots
Statistics is made approachable, and dare we say fun, in this activity on using box-and-whisker plots to analyze and compare data sets. Specific emphasis is placed on interpretations and explanations while graphing, and in using the...
US Department of Commerce
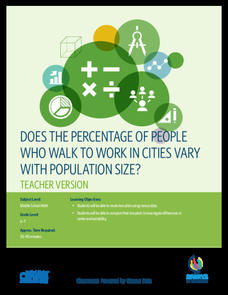
Does the Percentage of People Who Walk to Work in Cities Vary with Population Size?
To walk or not to walk? Pupils create box plots comparing the percentage of residents who walk to work in large, medium, and small cities. Using the box plots, class members compare the data that reflects available statistics. Scholars...
Teacherfiles
Plot Graph
Any story can be mapped onto a plot graph. This particular chart includes the mountain shape of a traditional plot graph. Each element of plot is labeled on the page and surrounded by a box to make the words stand out. Learners write in...
Willow Tree
Box-and-Whisker Plots
Whiskers are not just for cats! Pupils create box-and-whisker plots from given data sets. They analyze the data using the graphs as their guide.
Inside Mathematics
Archery
Put the better archer in a box. The performance task has pupils compare the performance of two archers using box-and-whisker plots. The resource includes sample responses that are useful in comparing individuals' work to others.
Mathematics Vision Project
Module 9: Modeling Data
How many different ways can you model data? Scholars learn several in the final module in a series of nine. Learners model data with dot plots, box plots, histograms, and scatter plots. They also analyze the data based on the data...
Flipped Math
Unit 4 Review: One Variable Statistics
It's always nice to slow down and review. Scholars work on problems covering concepts on one-variable statistics. They create and interpret box plots and stem-and-leaf plots, determine the mean, median, mode, interquartile range, and...
Utah Education Network (UEN)
Statistics
Find the value in analyzing data values. Statistics is the focus in the fifth of seven installments of the 6th Grade Math series. Individuals learn to examine dot plots, histograms, and box plots by considering the shape, mean, median,...
College Board
2008 AP® Statistics Free-Response Questions
Is your knowledge of statistics at an AP® level? Scholars try out the 2008 AP® Statistics free-response questions. The questions cover box plots, scatter plots, distributions, probability distributions, experiments, statistical tests,...
College Board
2009 AP® Statistics Free-Response Questions Form B
Is your class taking the AP® Statistics exam in the near future? You may want to take a look here. Using the 2009 AP® Statistics free-response questions Form B helps learners become familiar with the testing conditions, such as time...
College Board
2010 AP® Statistics Free-Response Questions Form B
Form a good familiarity with the AP® test using Form B of the 2010 AP® Statistics free-response questions. Pupils use a test from a previous administration to prepare for their exams. A set of six questions assesses box plots,...
EngageNY
Describing Center, Variability, and Shape of a Data Distribution from a Graphical Representation
What is the typical length of a yellow perch? Pupils analyze a histogram of lengths for a sample of yellow perch from the Great Lakes. They determine which measures of center and variability are best to use based upon the shape of the...
Scholastic
A Reading Guide to A Wrinkle in Time
Accompany a reading of Madeleine L'Engle's classic tale, A Wrinkle in Time, with a detailed guide equipped with 15 informative and useful chapters. Scholars discover who the author is, why she wrote the book, and crucial story elements...
Illustrative Mathematics
Puzzle Times
Give your mathematicians this set of data and have them create a dot plot, then find mean and median. They are asked to question the values of the mean and median and decide why they are not equal. Have learners write their answers or...
EngageNY
Comparing Distributions
Data distributions can be compared in terms of center, variability, and shape. Two exploratory challenges present data in two different displays to compare. The displays of histograms and box plots require different comparisons based...
Shmoop
Box, Stem-Leaf, and Histogram
A helpful and versatile activity requires young mathematicians to analyze data in order to create graphs and answer questions. Additionally, it prompts learners to find the mean, median, mode, and range of some of the data sets.
Other popular searches
- Analyzing Box Plots
- Outliers Box Plots
- Interpret Box Plots
- Graphs Box Plots
- Analysing Box Plots
- Leaf Box Plots
- Statistics Box Plots
- Conclude Box Plots
- Box Plots Worksheets
- Box Plot for Math
- Excel Box Plot
- Nba Box Plot


