Teach Engineering
Using Map Scales to Figure Distances and Areas
The asteroid is getting closer and the question is whether the state of Alabraska is large enough for the shelter calculated in the previous activity. Teams determine the scale of their project and then use the scale on the map to...
Curated OER
Use Google Maps to Teach Math
Capture the engagement of young mathematicians with this upper-elementary math lesson on measuring time and distance. Using Google Maps, students first measure and compare the distance and time it takes to travel between different...
University of Nottingham
Drawing to Scale: A Garden
See how design and geometry go hand in hand. The activity asks learners to use geometry to design a backyard garden given dimensions of each feature. Scholars work with ratios and scale to develop an accurate scale drawing that includes...
Space Awareness
Let's Map the Earth
Before maps went mobile, people actually had to learn how to read maps. Pupils look at map elements in order to understand how to read them and locate specific locations. Finally, young cartographers discover how to make aerial maps.
CK-12 Foundation
Topographic and Geologic Maps: Topographic Maps
Maps are great for helping you get where you're going, but what does that place actually look like? Geology scholars compare and contrast the features of topographical and geologic maps using an interactive lesson. The resource describes...
abcteach
Street Mapping
What's around the block? Or down the street? Ask your pupils to tap into their map skills by drafting the area around their home and school.
Museum of Science
Make a Map
It's important to know the final destination. Scholars first measure distances in a region of interest using a standard measuring device or by counting steps. They then use an appropriate scale and graph paper to create a map of the...
WindWise Education
What Factors Influence Offshore Wind?
What is that out in the water on the horizon? Teams work together to study the coastline using maps to determine the best and worst locations to place an offshore wind farm. The teams then build a scale model wind farm to see what it...
National Research Center for Career and Technical Education
Information Technology: Photoshop Scale
Scaling is a practical skill as well as a topic to be addressed throughout the Common Core math standards. You are given three different presentations and a detailed teacher's guide to use while teaching proportion, as well as practice...
NOAA
Wet Maps
How do oceanographers make maps under water? Junior explorers discover the technologies and processes involved in creating bathymetric maps in part three of a five-part series designed for fifth- and sixth-grade pupils. The lesson...
National Geographic
Mapping the Americas
Celebrate the geography of the Americas and develop map skills through a series of activities focused on the Western Hemisphere. Learners study everything from earthquakes and volcanoes of the Americas and the relationship...
Mathematics Assessment Project
Fruit Boxes
Perfect for visual and hands-on learners, an engaging lesson prompts pupils to consider the different-sized boxes they can create from a piece of cardboard. They develop a model to determine the size of the box with the greatest...
Edgate
Journal Maps
Inspire your class to look at their environments as if they were seeing them for the first time in order to gain a better understanding of the concept of perspective. After exploring their communities and keeping a journal of major...
Teach Engineering
Identifying Possible Underground Cavern Locations
Teams continue with the Asteroid Impact challenge and determine possible locations to construct their underground shelters. Participants cut scale area models of their shelters from paper and place them on the map to find locations...
Curated OER
Designing a Hiking Trail
Put your students' map skills to the test with this engaging cross-curricular project. Given the task of developing new hiking trails for their local community, young cartographers must map out beginner and intermediate...
Laboratory for Atmospheric and Space Physics
Charting the Progress of New Horizons
In 2006, New Horizons began its mission to fly to Pluto. As it continues its journey, scholars track its progress with the help of an informative website, all the while reinforcing measurement concepts with the construction of a scaled...
Laboratory for Atmospheric and Space Physics
A Classroom Solar System
Create a scaled model of our solar system in your classroom! Scholars work collaboratively to build paper mache planets and hang them in their proper position to showcase each planet's location in the solar system.
NOAA
Watching in 3D
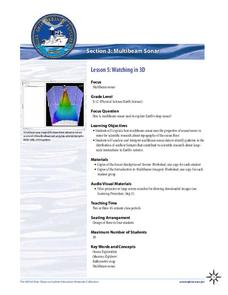
Bring the ocean floor to life! Earth science scholars discover the process of deep sea mapping in the third installment in a series of five lessons about ocean exploration. The teacher's guide includes helpful resources, worksheets, and...
Carnegie Mellon University
International Perspectives to Climate Change 1
After a lecture about how the first industrial revolution triggered the path to climate change, your environmental studies class discusses what the impacts are. In a culminating activity, they get into groups and identify countries on a...
Mathematics Vision Project
Circles: A Geometric Perspective
Circles are the foundation of many geometric concepts and extensions - a point that is thoroughly driven home in this extensive unit. Fundamental properties of circles are investigated (including sector area, angle measure, and...
Howard Hughes Medical Institute
Measuring Biodiversity in Gorongosa
Take your biology class' understanding of biodiversity to a whole new level! Ecology scholars use data to calculate three different diversity indices based on the organisms in the Gorongosa National Park. The four-part activity uses an...
K-State Research and Extensions
Water
How are maps like fish? They both have scales. The chapter includes six different activities at three different levels. Scholars complete activities using natural resources, learn how to read a map, see how to make a compass rosette,...
Howard Hughes Medical Institute
EarthViewer
Can you imagine Washington DC and London as close neighbors occupying the same continent? Learners will be fascinated as they step back in time and discover the evolution of the earth's continents and oceans from 4.5 billion...
Science 4 Inquiry
Edible Plate Tectonics
Many people think they can't observe plate tectonics, but thanks to GPS, we know that Australia moves at a rate of 2.7 inches per year, North America at 1 inches per year, and the Pacific plate at more than 3 inches per year! Scholars...


