Illustrative Mathematics
Designs
A resource that makes for excellent group work as students explore the area and perimeter of different complex designs made up of squares and circles. The commentary gives a clear definition of perimeter, but suggests that group members...
Curated OER
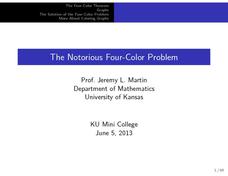
The Notorious Four-Color Problem
Take a walk through time, 1852 to 2005, following the mathematical history, development, and solution of the Four-Color Theorem. Learners take on the role of cartographers to study a United States map that is to be colored. One rule: no...
Curated OER
The Random Walk
Deep mathematical thinking is found with just a coin and a number line. Combining computing some probabilities in a discrete situation, and the interpretation of a function, this simple task gives learners a lot to think about on their...
Exploratorium
Oil Spot Photometer
Are these two light sources the same? Groups use a white card and a little cooking oil to create a photometer that allows for the comparison of two lights. The Inverse Square Law provides a way to calculate the actual difference in...
Curated OER
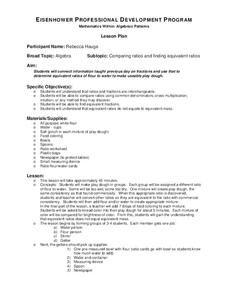
Mathematics Within: Algebraic Patterns
Students comprehend that ratios and fractions are interchangeable. They compare ratios using common denominators, cross multiplication, and intuition. Students find equivalent fractions. They comprehend that equivalent ratios do not...
EngageNY
Getting the Job Done—Speed, Work, and Measurement Units II
How fast is your class? Learners determine the amount of time it takes individuals to walk a given distance and calculate their speeds. Pupils solve distance, rate, and time problems using the formula and pay attention to the rate units.
EngageNY
Construct an Equilateral Triangle (part 1)
Drawing circles isn't the only thing compasses are good for. In this first installment of a 36-part series, high schoolers learn how to draw equilateral triangles by investigating real-world situations, such as finding the location of a...
EngageNY
Modeling with Inverse Trigonometric Functions 1
Where should I stand to get the best view? Pupils use inverse trigonometric functions to determine the horizontal distance from an object to get the best view. They round out the lesson by interpreting their answers within context.
EngageNY
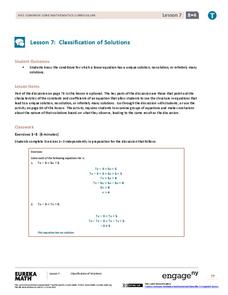
Classification of Solutions
Is there one, none, or more? Through discussion or activity, scholars find the properties of an equation that will determine the number of solutions. They then use the properties discovered to figure out the number of solutions for a...
EngageNY
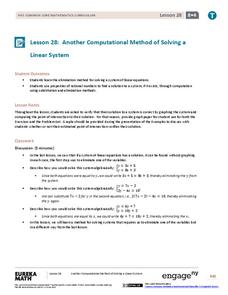
Another Computational Model of Solving a Linear System
The process of elimination really works! Use elimination when substitution isn't doing the job. The 29th segment in a series of 33 introduces the elimination method to solving linear systems. Pupils work several exercises to grasp the...
EngageNY
Every Line is a Graph of a Linear Equation
Challenge the class to determine the equation of a line. The 21st part in a 33-part series begins with a proof that every line is a graph of a linear equation. Pupils use that information to find the slope-intercept form of the equation...
EngageNY
Using Sample Data to Compare the Means of Two or More Populations II
The 23rd segment in a series of 25 presents random samples from two populations to determine whether there is a difference. Groups determine whether they believe there is a difference between the two populations and later use an...
EngageNY
From Ratio Tables to Equations Using the Value of a Ratio
Use the value of a ratio to set up equations. The teacher leads a discussion on determining equations from ratio tables in the 13th portion of a 29-part series. Pupils determine which of two equations to use to find the solution. They...
EngageNY
Interpreting and Computing Division of a Fraction by a Fraction—More Models II
No more inverting and multiplying to divide fractions. Applying concepts of measurement division from the previous lesson, pupils consider partitive division using fraction bars and number lines. They first convert fractions to like...
EngageNY
Comparing Integers and Other Rational Numbers
The ninth installment of a 21-part module has pupils compare integers and rational numbers in decimal and fraction form. They match stories to number lines and compare values in the stories.
EngageNY
Describing Center, Variability, and Shape of a Data Distribution from a Graphical Representation
What is the typical length of a yellow perch? Pupils analyze a histogram of lengths for a sample of yellow perch from the Great Lakes. They determine which measures of center and variability are best to use based upon the shape of the...
EngageNY
Construct a Perpendicular Bisector
How hard can it be to split something in half? Learners investigate how previously learned concepts from angle bisectors can be used to develop ways to construct perpendicular bisectors. The resource also covers constructing a...
EngageNY
Constant Rates Revisited
Find the faster rate. The resource tasks the class to compare proportional relationships represented in different ways. Pupils find the slope of the proportional relationships to determine the constant rates. They then analyze the rates...
EngageNY
Changing Scales
Pupils determine scale factors from one figure to another and the scale factor in the reverse direction. Scholars compute the percent changes between three figures.
EngageNY
Estimating Probabilities by Collecting Data
Take a spin to determine experimental probability. Small groups spin a spinner and keep track of the sums of the spins and calculate the resulting probabilities. Pupils use simulated frequencies to practice finding other probabilities to...
EngageNY
Comparison Shopping—Unit Price and Related Measurement Conversions
Speed up your scholars' understanding of ratios. Class members compare ratios related with speeds presented in different representations. They then use the unit rates to make the comparisons.
EngageNY
More Practice with Box Plots
Don't just think outside of the box — read outside of it! The 15th activity in a 22-part unit provides pupils more work with box plots. Learners read the box plots to estimate the five-number summary and interpret it within the context....
Curated OER
The Foundation of Math and Science
Students uncover the mathematical proportions as well as the history of the Parthenon. In this math and science lesson, students use research to find the contributions of ancient Greeks made to our current society. They explore the...
Project Maths
Complex Number Operations
What do animated videos have to do with mathematics? Using operations of complex numbers and their representations on the complex plane, high schoolers observe how mathematics could be used to move animations. The lesson provides an...
Other popular searches
- History of Mathematics
- Discrete Mathematics
- Mathematics Line Symmetry
- Everyday Mathematics
- Montessori Mathematics
- Writing in Mathematics
- Mathematics Mode and Median
- Applied Mathematics
- Mathematics Times Tables
- Christmas Mathematics
- B Ed Mathematics
- Discrete Mathematics Graph


