August House
The Clever Monkey Rides Again
Use a West African folktale to practice several different skills in your first grade classroom. Learners read The Clever Monkey Rides Again and focus on rhyming words, reading comprehension, measurement, art, movement, and word order.
EngageNY
Fundamental Theorem of Similarity (FTS)
How do dilated line segments relate? Lead the class in an activity to determine the relationship between line segments and their dilated images. In the fourth section in a unit of 16, pupils discover the dilated line segments are...
Curated OER
Math, Fractions, and Music
Students discover the relationship between musical rhythms and fractions. They add musical notes together to produce fractions and create addition and subtraction problems with musical notes. Students complete worksheets and create their...
Curated OER
Comparing Light Bulbs
An average home produces twice as many emissions as an average car. Teach your class how to reduce energy consumption by replacing standard incandescent light bulbs with compact fluorescent light bulbs. Perform an experiment to compare...
University of Houston
Volume for Rectangular Prisms
Upper graders define perimeter and area of a rectangle, estimate numbers of cubes and determine the maximum amount that will fit in a given space. In this math activity, pupils complete related worksheet, build prisms and find volume and...
Illustrative Mathematics
Banana Pudding
Making banana pudding despite misplacing your one-cup measuring cup is easy as long as you can find your quarter-cup measuring cup! This real-life activity provides a good opportunity for learners to interpret division of a whole number...
EngageNY
The Mean Absolute Deviation (MAD)
Is there a way to measure variability? The ninth resource in a series of 22 introduces mean absolute deviation, a measure of variability. Pupils learn how to determine the measure based upon its name, then they use the mean absolute...
Virginia Department of Education
Angles in Polygons
Polygons — it's all about the angles. Groups work with dynamic geometry software to find the sum of the measures of the angles of various polygons. After finding the information for several polygons, the groups generate a formula that...
PBS
Heart to Heart
Study heart health and math in one activity. After measuring their resting heart rates by finding the pulse in their wrists, learners build a stethoscope to listen to their heart rate, and note the differences between the two methods.
National Research Center for Career and Technical Education
Back to Basics
Your class will enjoy this Health Science lesson created by CTE and math teachers from Missouri. Learners make conversions between the apothecary system and metric and US standard measurements used in the healthcare field. The CTE...
West Contra Costa Unified School District
The Power of Ten: Building a Magnitude Model
Add visual representation to teaching place value with a magnitude model. Using adding machine tape, pupils build a linear place value strip from 1 to 100.
Differentiation Central
Perimeter and Area
Leave no student behind with this differentiated geometry unit on perimeter and area. Over the course of five lessons, young mathematicians explore these foundational concepts through a series of self-selected hands-on activities and...
Virginia Department of Education
Analyzing and Interpreting Statistics
Use measures of variance to compare and analyze data sets. Pupils match histograms of data sets to their respective statistical measures. They then use calculated statistics to further analyze groups of data and use the results to make...
Curated OER
Drive the Data Derby
Three days of race car design and driving through the classroom while guessing probability could be a third graders dream. Learn to record car speed, distances traveled, and statistics by using calculation ranges using the mean, median,...
EngageNY
The Slope of a Non-Vertical Line
This lesson introduces the idea of slope and defines it as a numerical measurement of the steepness of a line. Pupils then use the definition to compare lines, find positive and negative slopes, and notice their definition holds for...
Royal Society of Chemistry
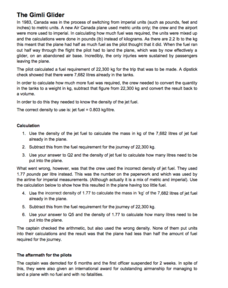
Gimli Glider—Anecdotes for Chemistry Teachers
What's the moral of this story? Units save lives! Teach measurement conversion through storytelling in a quick math-based lesson. Young scientists learn how one country's decision to swap from imperial to metric standard units caused an...
EngageNY
Interpreting and Computing Division of a Fraction by a Fraction—More Models II
No more inverting and multiplying to divide fractions. Applying concepts of measurement division from the previous lesson, pupils consider partitive division using fraction bars and number lines. They first convert fractions to like...
EngageNY
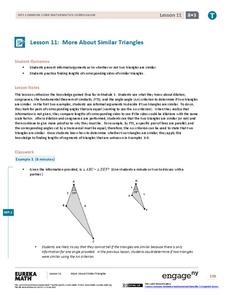
More About Similar Triangles
Determine whether two triangles are similar. The lesson presents opportunities for pupils to find the criterion needed to show that two triangles are similar. Scholars use the definition of similarity to find any missing side...
EngageNY
Describing Center, Variability, and Shape of a Data Distribution from a Graphical Representation
What is the typical length of a yellow perch? Pupils analyze a histogram of lengths for a sample of yellow perch from the Great Lakes. They determine which measures of center and variability are best to use based upon the shape of the...
Virginia Department of Education
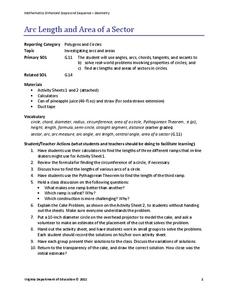
Arc Length and Area of a Sector
What do skateboarding and baked goods have in common with math? You can use them to connect half-pipe ramps and cakes to arcs and sectors. Pupils compare the lengths of three different ramp options of a skate park. They calculate the...
Curated OER
Length, Weight and Measures
Students complete measurement activities. In this measurement lesson plan, students watch online clips about measurements. Students view items and discuss taking measurements of them. Students discuss what units of measurement and...
Curated OER
How Big Is A Humpback Whale?
Students explore humpback whales. In this humpback whale lesson, students determine the actual size of humpback whales and use diagrams to identify the major features of the humpback whale.
Curated OER
Data Analysis, Probability, and Discrete Math
Choose to supplement your probability unit with this resource and you won't be disappointed with the outcome. Teach young mathematicians to organize information using tree diagrams and lists in order to determine the possible outcomes of...
Workforce Solutions
Evacuate!
After a hurricane touches down on an area, locals begin the clean-up process. The Cynergy Plant requires cleaning, a blood drive is underway, temporary homes are needed for those that evacuated, and toiletries are rationed. Five lessons...
Other popular searches
- Perimeter Math Measurement
- Math Measurement Inches
- Math Measurement Lesson Plans
- Math Measurement Length
- Math Measurement Metric
- Esl Math Measurement
- Math Measurement Worksheets
- Esol Math Measurement
- Math Measurement Lessons
- Liquid Measurement in Math
- Measurement/math Literature
- Angle Measure Math


