Curated OER
US Population 1982-1988
Your algebra learners make predictions using the concepts of a linear model from real-life data given in table form. Learners analyze and discuss solutions without having to write a linear equation.
Illustrative Mathematics
Anna in D.C.
The amount of tax and tip on a restaurant bill is a common example used in percent problems. Here, learners only know the total amount paid, and they need to figure the itemized amounts. Solutions using a ratio table, using knowledge of...
Illustrative Mathematics
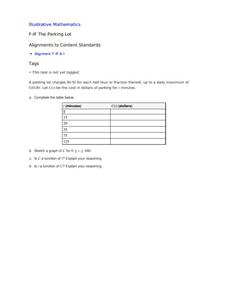
The Parking Lot
Use the real-world cost of parking a car to demonstrate the properties of a function. The resource describes to learners how much it is to park in a certain lot. It is up to your number crunchers to complete a table of minutes and...
Curated OER
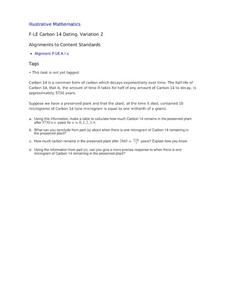
Carbon 14 Dating, Variation 2
Your archaeologists begin this task with a table of values to estimate the time passed based on the half-life of Carbon 14 remaining in a plant. They then move on to find when a specific amount of Carbon 14 is present in the same plant,...
Curated OER
Taxi!
Your young taxi drivers evaluate and articulate the reasoning behind statements in a conceptual task involving linear data. The given data table of distances traveled and the resulting fare in dollars is used by learners to explore...
Howard County Schools
Generous Aunt
Witness the power of exponential growth with an activity that investigates two different savings plans. Class members create tables of values to see how and when a savings plan increasing exponentially exceeds one increasing linearly.
5280 Math
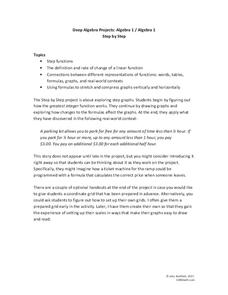
Step by Step
One step at a time! A seemingly linear relationship becomes an entirely new type of function. Young scholars build their understanding of step functions by completing a three-stage activity that incorporates multiple representations of...
Mathematics Vision Project
Module 9: Statistics
All disciplines use data! A seven-lesson unit teaches learners the basics of analyzing all types of data. The unit begins with a study of the shape of data displays and the analysis of a normal distribution. Later lessons discuss the...
Mathematics Vision Project
Module 10: Matrices Revisited
A matrix is just a fancy way of making a table. Young scholars explore operations with matrices with the first lessons in the final module of a 10-unit Algebra II series. After adding, subtracting, and multiplying matrices, pupils use...
EngageNY
Dividing by (x – a) and (x + a)
Patterns in math emerge from seemingly random places. Learners explore the patterns for factoring the sum and differences of perfect roots. Analyzing these patterns helps young mathematicians develop the polynomial identities.
Achieve
Yogurt Packaging
Food companies understand how to use math to their advantage. Learners explore the math related to the packaging and serving size of yogurt. They then use unit analysis and percent values to make decisions on the product development.
EngageNY
Why Call It Tangent?
Discover the relationship between tangent lines and the tangent function. Class members develop the idea of the tangent function using the unit circle. They create tables of values and explore the domain, range, and end behavior of the...
EngageNY
Basic Trigonometric Identities from Graphs
Have young mathematicians create new identities! They explore the even/odd, cofunction, and periodicity identities through an analysis of tables and graph. Next, learners discover the relationships while strengthening their understanding...
EngageNY
Graphing the Tangent Function
Help learners discover the unique characteristics of the tangent function. Working in teams, pupils create tables of values for different intervals of the tangent function. Through teamwork, they discover the periodicity, frequency, and...
EngageNY
Correspondence and Transformations
Looking for a strategy to organize the information related to transformations? The materials ask pupils to identify a sequence of rigid transformations, identify corresponding angles and sides, and write a congruence statement. They...
EngageNY
Graphing Cubic, Square Root, and Cube Root Functions
Is there a relationship between powers and roots? Here is a lesson that asks individuals to examine the graphical relationship. Pupils create a table of values and then graph a square root and quadratic equation. They repeat the process...
Curated OER
Sort It Out
Elementary schoolers engage in a game of logical reasoning called Secret Sort. A Venn diagram is used as a way to sort objects. This resource would be a great way to introduce the Venn diagram (maybe the most famous, and most-useful...
Curated OER
An Introduction To Volume
Upper graders explore the topic of volume. In this math lesson plan, pupils count volume in cubic units, multiply to find volume, estimate volume, write a multiplication sentence to find the volume, and make a cost analysis of different...
Curated OER
Division for Third Graders
Explore division and measurement relationships with your math class. They will work in pairs to measure and cut a piece of cord 100 centimeters or longer. Then they cut off equal pieces of less than 10 centimeters until all the cord is...
Curated OER
Cold, Clouds, and Snowflakes
Students explore satellite data and graphing. In this weather data analysis math and science instructional activity, students analyze NASA satellite data to draw conclusions about geographical areas where precipitation might have...
Curated OER
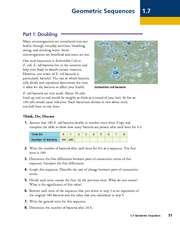
Geometric Sequences - Bacterial Growth
Bring algebra to life with scientific applications. Math minded individuals calculate and graph the time it takes a bacterium to double. They discuss geometric sequences and use a chart to graph their findings. There are 38 questions all...
Curated OER
What Can Data Tell Us?
Students explore data distribution. In this data analysis lesson, students create a data distribution table by playing the game "Tower of Hanoi" from the Hall of Science. Students analyze their data and answer data driven questions.
Achieve
Framing a House
If members of your class wonder where they can use the math they learn in middle school, let them discover the answer. Learners apply geometry concepts of scale and measure to calculate the costs of framing a house addition.
Achieve
Dairy Barn
Agriculture is truly a math-based profession! Help the dairy farmer determine the supplies needed to complete his barn. Using given dimensions, learners build equations and use units to determine the correct amount of materials.
Other popular searches
- Math Tables and Tools
- +Math Tables Tips Tools
- Input Output Table Math
- Math Table. Elementary Math
- Math Tables Tips Tools
- Math Tables and Graphs
- Making Math Tables
- Input/output Tables Math
- Math Table Elementary Math
- Learning Math Tables
- Math Tables Multiplacation
- Making a Math Table


