Code.org
Creating Functions with Parameters
The pupils practice modifying parameters in a function to add variations to their under the sea scene. The resource also introduces random number functions that alter the scene every time the program runs.
Illustrative Mathematics
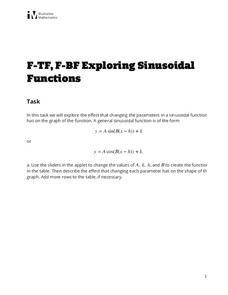
Exploring Sinusoidal Functions
What effect does changing a parameter have on the graph of a trigonometric function? Pupils use a Desmos applet to explore the general sine graph. They experiment changing different parameters and record the resulting change of the...
National Wildlife Federation
Get Your Techno On
Desert regions are hotter for multiple reasons; the lack of vegetation causes the sun's heat to go straight into the surface and the lack of moisture means none of the heat is being transferred into evaporation. This concept, and other...
BW Walch
Linear & Exponential Functions
Positioned inside the framework of linear and exponential functions, this lesson is more of an investigation into the effects of changing variables and constants inside an expression. The author takes familiar formulas, those for...
Shodor Education Foundation
Rabbits and Wolves
A change in a parameter can end in overpopulation. The resources gives pupils the opportunity to control the parameters of rabbits and wolves in a natural setting. Using the set parameters, the simulation runs and displays the population...
Anchorage School District
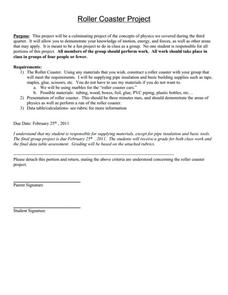
Roller Coaster Project
Emerging engineers work in teams to design pipe insulation roller coasters for marbles that meet specific parameters. They are required to label along the track the areas where kinetic and potential energy are highest and lowest, where...
Shodor Education Foundation
Plop It!
Build upon and stack up data to get the complete picture. Using the applet, pupils build bar graphs. As the bar graph builds, the interactive graphically displays the mean, median, and mode. Learners finish by exploring the changes in...
Teach Engineering
Ice, Ice, PV!
Knowing the temperature coefficient allows for the calculation of voltage output at any temperature. Groups conduct an experiment to determine the effects of temperature on the power output of a solar panel. The teams alter the...
Shodor Education Foundation
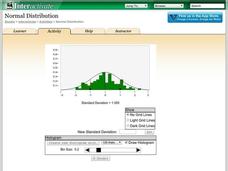
Normal Distribution
Does the size of the bin matter? The resource allows pupils to explore the relationship between the normal curve and histograms. Learners view histograms compared to a normal curve with a set standard deviation. Using the interactive,...
EngageNY
Curves from Geometry
Escape to investigate hyperbolas. Pupils take a look at what happens to the elliptical orbital path of a satellite that exceeds escape velocity as the opener to the eighth lesson in a unit of 23. Scholars analyze basic hyperbolas and how...
Shodor Education Foundation
Overlapping Gaussians
Adjust the overlap to compare probabilities. Using sliders, learners adjust the shape of two Gaussian curves. The interactive calculates the area of the left tail for one curve and the right tail for the other. Pupils set the interactive...
Radford University
Rocket Quads
How high will it fly? Pairs build straw rockets and launch them at different angles and determine the height and horizontal distance of the flight path. Teams make conjectures about how the angle affects the measured distances and use...
EngageNY
Transforming Rational Functions
Move all rational functions—well, maybe. Learners investigate the graphs of the reciprocals of power functions to determine a pattern between the graph and the power. Pupils graph rational functions where transformations are clearly...
Mathematics Assessment Project
Modeling Motion: Rolling Cups
Connect the size of a rolling cup to the size of circle it makes. Pupils view videos of cups of different sizes rolling in a circle. Using the videos and additional data, they attempt to determine a relationship between cup...
Shodor Education Foundation
InteGreat
Hands-on investigation of Riemann sums becomes possible without intensive arithmetic gymnastics with this interactive lesson plan. Learners manipulate online graphing tools to develop and test theories about right, left, and...
EngageNY
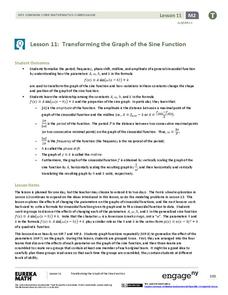
Transforming the Graph of the Sine Function
Build a solid understanding of trigonometric transformations through exploration. Learners work in teams to analyze the effects of different algebraic components on the graph of a sine function.
EngageNY
Comparing Linear and Exponential Models Again
Making connections between a function, table, graph, and context is an essential skill in mathematics. Focused on comparing linear and exponential relationships in all these aspects, this resource equips pupils to recognize and interpret...
Shodor Education Foundation
Skew Distribution
Slide the class into a skewed view. Learners alter the location of the median relative to the mean of a normal curve to create a skew distribution. They compare the curve to a histogram distribution with the same skewness.


