Radford University
Snappy Stair Sprints
Let's go for a run. Small groups determine a way to collect data to determine the time it would take to run a set of stairs. After creating a plan, teams collect data and graph their results, calculating the equation of best fit and...
University of California
Seasons Lab Book
Unlock the mystery behind seasonal change with a collection of worksheets and activities. Whether they are drawing pictures of Earth's orbit around the sun or graphing the temperature and daylight hours of different locations from around...
Shodor Education Foundation
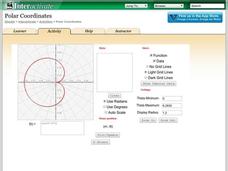
Polar Coordinates
Polar opposites might not work together—but polar coordinates do! The interactive provides learners the opportunity to graph trigonometric and algebraic functions using polar coordinates. The program takes either individual data points...
Mathed Up!
Pie Charts
Representing data is as easy as pie. Class members construct pie charts given a frequency table. Individuals then determine the size of the angles needed for each sector and interpret the size of sectors within the context of frequency....
Curated OER
Fishy Behavior
Here's a lab that may make you rethink that morning cup of coffee. Biology scholars test the effects of caffeine, alcohol, and nicotine on the behavior of zebrafish through an intriguing experiment. Learners observe fish behavior before...
Radford University
Can I Create a Line/Curve of Best Fit to Model Water Drainage?
Learners collect data on the amount of water left in a bottle over time. They graph the data to determine whether the scatter plot shows a curved or straight relationship. Group members then determine an equation for the curve of best...
PBS
The Lowdown — U.S. Gun Homicides: Visualizing the Numbers
Is gun violence a big issue in America? Pupils explore gun deaths by type, race, and age group in a Math at the Core: Ratios interactive. The class tries to determine whether America is a safe place to live and use bar graphs and pie...
abcteach
What is Your Favorite Month?
A simple worksheet that helps learners conduct a survey is here for you. In it, pupils collect data on their family and classmate's favorite months. Youngsters use tally marks in the spaces provided to keep track of the answers. Once...
Anti-Defamation League
Pink Collar Jobs: Gender Segregation and Pay Inequality in the Workplace
Cartoons showing women in the workplace spark a discussion about being a business executive and claiming the corporate ladder. Small groups analyze data and create graphs that display essential information from the handouts. The class...
Beyond Benign
Exothermic and Endothermic Reactions
How can you tell the difference between endothermic and exothermic reactions? Chemistry scholars perform and observe two chemical reactions, measure the temperature throughout, then draw conclusions about changes in energy from their...
EngageNY
Exponential Decay
I just bought that car, how can its value decrease already? Individuals use the data of a depreciating car value to create an exponential decay model. They then compare exponential decay and growth equations.
Cornell University
Non-Newtonian Fluids—How Slow Can You Go?
Children enjoy playing with silly putty, but it provides more than just fun. Young scientists make their own silly putty using different recipes. After a bit of fun, they test and graph the viscosity of each.
Mathalicious
Domino Effect
Carryout the lesson to determine the cost of pizza toppings from a Domino's Pizza® website while creating a linear model. Learners look through real data—and even create their own pizza—to determine the cost of each topping. They explore...
Curated OER
Music and Sports
With so much talent in the classroom, do your musicians and athletes have related interests? This problem has your learners taking data from their classmates to decide whether there is an association between the two activities. The...
Curated OER
Basketball Bounces, Assessment Variation 2
This un-scaffold summative assessment tasks learners to use the height of a bouncing basketball, given the data in graph and table form, to choose the model that is represented. Learners then use the model to answer questions about the...
Curated OER
Basketball Bounces, Assessment Variation 1
This highly scaffolded, summative assessment tasks learners to choose the model that represents the height of a bouncing basketball given the data in graph and table form. Learners then use the model to answer questions about the...
Florida Department of Health
Nutrition: Developing Healthy Habits Unit
The focus of the fourth unit in the Youth Risk Behavior Survey Curriculum is on healthy eating and exercise. Class members examine healthy habits data from the YRBD Youth Online Tool, learn about the importance of a healthy diet and...
Science 4 Inquiry
Journey Through the Spheres of the Earth
Each of the Earth's spheres interacts with the other spheres in predictable ways. Young scientists explore these interactions through a hands-on activity, graphing, and watching a video. They summarize their knowledge in a video or...
Chicago Botanic Garden
Micro-GEEBITT Climate Activity
A truly hands-on and inquiry based learning activity bridges all the lessons in the series together. Beginning with a discussion on average global temperatures, young meteorologists use real-world data to analyze climate trends in order...
Montana State University
What's the Weather?
How many jackets do you need to stay warm and climb Mount Everest? An informatie resource covers the topic of Mount Everest, the resource helps young scientists discover the difference between climate and weather. Activities include...
National Wildlife Federation
I’ve Got the POWER! Solar Energy Potential at Your School
Should every school have solar panels? The 19th lesson in a series of 21 has scholars research the feasibility of using solar panels at their school. They begin by gathering data on the solar energy in the area before estimating the...
University of California
Student Workbook: Algebra and Functions
A smorgasbord of functions, this packet has the basics required for your learners to be successful in the land of early algebra. The packet includes solving equations, graphing, evaluating, simplifying and basically everything else in...
National Council of Teachers of Mathematics
Varying Motion
For this secondary mathematics learning exercise, high schoolers collect data based on a person’s motion. From this data, students create graphs comparing displacement, velocity, and acceleration to time. The five-page learning exercise...
EngageNY
From Ratio Tables, Equations and Double Number Line Diagrams to Plots on the Coordinate Plane
Represent ratios using a variety of methods. Classmates combine the representations of ratios previously learned with the coordinate plane. Using ratio tables, equations, double number lines, and ordered pairs to represent...
Other popular searches
- Graphing Data
- Graphing and Analyzing Data
- Graphing Data Project
- Collecting and Graphing Data
- Graphing Data in Science
- Organizing and Graphing Data
- Mathematics Graphing Data
- Graphing Information
- Line Graphing Data
- Graphing Data in Astronomy
- Graphing and Inputting Data
- Graphing Data With Candy


