EngageNY
Estimating Probabilities by Collecting Data
Take a spin to determine experimental probability. Small groups spin a spinner and keep track of the sums of the spins and calculate the resulting probabilities. Pupils use simulated frequencies to practice finding other probabilities to...
Shodor Education Foundation
Scatter Plot
What is the relationship between two variables? Groups work together to gather data on arm spans and height. Using the interactive, learners plot the bivariate data, labeling the axes and the graph. The resource allows scholars to create...
Museum of Tolerance
Why is This True?
Are wages based on race? On gender? Class members research wages for workers according to race and gender, create graphs and charts of their data, and compute differences by percentages. They then share their findings with adults and...
Shodor Education Foundation
Box Plot
What information can come from a box? Learners choose a data set to display as a box plot and decide whether to include the median in the calculation of the quartiles, show the outliers, and change the scale. To finish the lesson,...
Council for Economic Education
FRED and the Federal Budget Interactive Lesson
How can a federal debt accumulate over time? The Federal Reserve Economic Data (FRED) dashboard allows scholars to actively research each aspect of the federal budget. In pairs, they analyze economic data to determine the best way to...
Shodor Education Foundation
Measures
Take a look at data from a statistical lens. An interactive allows pupils to enter data set, labeling the data including the units used. Manipulating the applet, learners select the statistics to calculate that include total, mean,...
Shodor Education Foundation
Sequencer
Take the first step into graphing sequences. Learners set the starting number, multiplier, add-on, and the number of steps for a sequence. Using the inputs, the interactive calculates and plots the sequence on the coordinate plane. Users...
Curated OER
Mystery Jars
This is a twist on the old "guess how many jellybeans" game. Using estimation and math skills, learners participate in a fun "mystery jars" activity, trying to make educated guesses at how many objects are in two jars. The basic activity...
NOAA
Through Robot Eyes
How do robots assist ocean explorers in collecting data and images? The final installment in a five-part series has science scholars examine underwater images collected by robots and identify the organisms shown. Groups then calculate...
NASA
Cloudy vs. Clear - Graphs
Explore the link between solar energy and cloud cover using real data from NASA from China! Future climatologists analyze and interpret graphs of solar energy on clear and cloudy days using a literacy cube. Investigators draw conclusions...
Anti-Defamation League
Pink Collar Jobs: Gender Segregation and Pay Inequality in the Workplace
Cartoons showing women in the workplace spark a discussion about being a business executive and claiming the corporate ladder. Small groups analyze data and create graphs that display essential information from the handouts. The class...
Houston Area Calculus Teachers
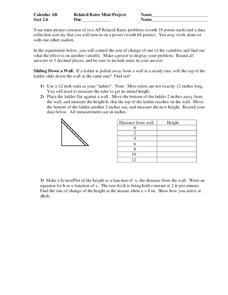
Related Rates
Use a hands-on approach to exploring the concepts of related rates in your AP Calculus class. Individuals explore the effect of the rate of change on a variable related to a variable they control. After analyzing the data they collect,...
Howard Hughes Medical Institute
Niche Partitioning Activity
Dinnertime on the African savanna is a highly choreographed event! Introduce young ecologists to the concept of niche partitioning through a hands-on activity. Pupils research animal behaviors and use data to develop an understanding of...
Virginia Department of Education
Growing Patterns and Sequences
Learners explore, discover, compare, and contrast arithmetic and geometric sequences in this collaborative, hands-on activity. They build and analyze growing patterns to distinguish which kind of sequence is represented by a set of data...
University of Georgia
Endothermic and Exothermic Reactions
Equip your chemistry class with the tools to properly understand endothermic and exothermic reactions. Young chemists collect, analyze, and graph data to determine how the Law of Conservation of Matter is applied to chemical composition...
Curated OER
Round and Round
Learners interpret data from a three-dimensional array of current monitors to determine an overall pattern of water circulation. They hypothesize what effect an observed water circulation pattern might have on seamount fauna. A very...
National Security Agency
It's Probably Probable
Learners make predictions and draw conclusions from given information as they learn the meaning of probability in this vocabulary-rich, integrated activity that presents a variety of teaching strategies to motivate and reach all learning...
NASA
Two Versions of Gravity: Newton and Einstein
We have all heard the debate about teaching both theories, but an innovative lesson takes the discussion to a new level. Scholars research and debate Newton's Law of Gravitation versus Einstein's General Theory of Relativity with...
EngageNY
More Practice with Box Plots
Don't just think outside of the box — read outside of it! The 15th lesson in a 22-part unit provides pupils more work with box plots. Learners read the box plots to estimate the five-number summary and interpret it within the context....
University of Minnesota
Makes Me Sweat
Never let them see you sweat ... unless you can't help it! Scholars design an experiment to determine the effects of stress on the body. They monitor sweat production under different conditions and relate the response to the function of...
K20 LEARN
Ecosystems, Human Activity, And Interactions, Oh My!: Human/Environment Interaction
Word clouds about ecosystems hook learners into a lesson that explores Yellowstone wildlife. Young scientists create cause-and-effect relationships after examining data and recommend solutions to their observed problems. More data...
ReadWriteThink
Looking for the History in Historical Fiction: An Epidemic for Reading
Combine informational reading skills with fictional text in an innovative historical fiction lessons. After reading a fictional text related to diseases, class members read non-fictional text to gain knowledge about specific infectious...
Serendip
Photosynthesis and Cellular Respiration
How does energy from the sun make plants grow? Scholars move step by step through the processes that promote plant propagation during a detailed lesson. The resource illustrates ADP production and hydrolysis, then allows learners to...
Barnstable Public Schools
Math Relay Races
A plethora of activities make up a cross curricular choice page filled with math games—relay races, dice, and crossword puzzles—a survey challenge equipped with data organization, graphing, a quicksand recipe, Hula-Hoop activity to...
Other popular searches
- Misleading Data Display
- Appropriate Data Display
- Display Data
- Graphs and Data Display
- Display Simple Data
- Data Display Center
- Voluntary Data Display
- Best Data Display
- Data Display and Analysis
- Rates and Data Display
- Simulation Data Display
- Ways to Display Data


