EngageNY
Graphs Can Solve Equations Too
There are many equations Algebra I learners are not ready to solve. Graphing to solve gives them a strategy to use when they are unsure of an algebraic approach to solve the problem. The lesson exposes learners to a wide variety of types...
Shodor Education Foundation
Graph Sketcher
Sketch graphs with the Graph Sketcher. Scholars graph functions on a coordinate plane. An interactive makes it as easy as inputting the function and clicking a button.
EngageNY
Revisiting the Graphs of the Trigonometric Functions
Use the graphs of the trigonometric functions to set the stage to inverse functions. The lesson reviews the graphs of the basic trigonometric functions and their transformations. Pupils use their knowledge of graphing functions to model...
NASA
Weightless Wonder
A video of the weightless wonder provides a setting for the math to follow. Groups analyze the graph of a quadratic function that models the path of the C-9 as it gives astronauts the experience of weightlessness. Using a graphing...
EngageNY
Graphing the Logarithmic Function
Teach collaboration and communication skills in addition to graphing logarithmic functions. Scholars in different groups graph different logarithmic functions by hand using provided coordinate points. These graphs provide the basis for...
NASA
Ascent: 50 Seconds to MECO
All systems go! With a video and a Google Earth tour as background, pairs investigate two graphs. The graphs display acceleration vs. time and velocity vs. time of a space shuttle launch. Using graphing calculators, the pairs take a...
Annenberg Foundation
Skeeters Are Overrunning the World
Skeeters are used to model linear and exponential population growth in a wonderfully organized lesson plan including teachers' and students' notes, an assignment, graphs, tables, and equations. Filled with constant deep-reaching...
EngageNY
Modeling a Context from Data (part 2)
Forgive me, I regress. Building upon previous modeling activities, the class examines models using the regression function on a graphing calculator. They use the modeling process to interpret the context and to make predictions based...
NASA
Space Shuttle Ascent: Mass vs. Time
Set the stage for groups of rocket scientists to explore the change in mass of the space shuttle during ascent. Teams work together to graph actual launch data in order to determine the rate of propellent burn.
SHS Algebra
Transformations of Linear and Exponential Graphs
Your transformers will create and analyze graphs to discover which operations produce which transformations. Linear and exponential functions are used to model the transformations.
Curated OER
Measurement and Algebraic Thinking
Comparatively speaking, does a bug travel farther than a human in 10 seconds? Get a bug and measure how far it travels in 10 seconds. Have a human team member run for 10 seconds and calculate the distance ran. Answer the question,"Who...
BW Walch
Solving Systems of Linear Equations
Solving systems of equations underpins much of advanced algebra, especially linear algebra. Developing an intuition for the kinds and descriptions of solutions is key for success in those later courses. This intuition is exactly what...
Curated OER
Exponential Growth versus Linear Growth II
Your algebra learners discover that exponential functions, with a base larger than one, outgrow linear functions when the inputs increase sufficiently. Their analysis includes using a graphing calculator to produce tables.
Curated OER
A Sum of Functions
Collaborative learners will see the geometric addition of functions by graphing the sum of two graphed curves on the same coordinate plane. This task then naturally flows into giving learners the algebraic representation of the curves...
Point Pleasant Beach School District
Parabola Project
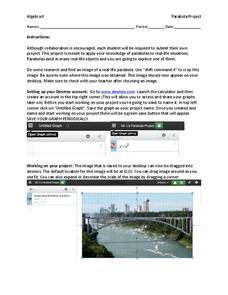
Class members select a picture that contains a parabola and construct a drawing of it using function graphs in the quadratic project. Individuals restrict the domains of the functions to create a more accurate drawing. They then submit a...
Fall River Schools
Parabolas Are All Around Us
Moving parabolas off of graph paper and into the real world is the task at hand in this detailed poster project. First, learners perform a cumulative activity identifying many characteristics of an assigned quadratic equation. Next, they...
NASA
Next Generation Spacecraft—Orion
What is the cross-sectional area of the Orion spacecraft? Groups work together to estimate the area of a cross section of the Orion spacecraft by first counting the number of grids a scale drawing covers. Pupils also employ a method...
Shodor Education Foundation
InteGreat
Hands-on investigation of Riemann sums becomes possible without intensive arithmetic gymnastics with this interactive lesson plan. Learners manipulate online graphing tools to develop and test theories about right, left, and midpoint...
NASA
Lunar Rover
What is the shortest distance/time needed to complete a mission? Groups devise a strategy in order to determine the shortest distance and time connecting two points and a segment. They then use graphing, the distance formula, and a...
EngageNY
Interpreting Correlation
Is 0.56 stronger than -0.78? Interpret the correlation coefficient as the strength and direction of a linear relationship between two variables. An algebra lesson introduces the correlation coefficient by estimating and then calculating it.
EngageNY
Modeling a Context from a Verbal Description (part 1)
When complicated algebraic expressions are involved, it is sometimes easier to use a table or graph to model a context. The exercises in this lesson plan are designed for business applications and require complex algebraic expressions.
Curated OER
Newton's Law of Cooling
Your Algebra learners analyze and solve an exponential equation in this popular, real-life model of the cooling of a liquid.
NASA
Space Shuttle Ascent: Altitude vs. Time
How long did it take to get to that altitude? Using a Google Earth file, groups explore a space shuttle launch. Using a calculator, groups determine the function that models the altitude/time data from an actual launch. With the model in...
University of North Texas
Math Exam 1 Review
Perfect as a review guide, this instructional activity provides a range of questions focusing on functions. Topics include composing functions, transformations, domains, and polynomials. Also included are corresponding worksheets...


