Shodor Education Foundation
Spinner
Go round and round to compare theoretical and experimental probabilities. Learners set the number of sectors and the number of spins for a spinner. Then, a table displays the experimental and theoretical probabilities of the spinner for...
CK-12 Foundation
Add and Subtract Three Mixed Numbers: Walking to School
Mixed numbers are the focus of a five-question interactive. Scholars move fraction pieces into strips and equations to find solutions. Questions challenge participants with multiple-choice, a true or false, and one discussion.
Curated OER
New York State Testing Program Grade 8 Math Sample Test 2005
In this New York state sample test worksheet, 8th graders solve thirty-three sample math problems designed to help students prepare for the grade eight math test. Tips for taking the test are provided.
Curated OER
Function Tables
Students identify function using tables of data. In this algebra instructional activity, students create a tale of point and plot on a coordinate plane. They analyze the graph as being a function or not.
Curated OER
What Did It Cost 100 Years Ago?
Students compare prices of good across the century in order to introduce the topic of inflation. They undertand the concepts of inflation and Consumer Price Index (CPI), use online calculators to figure the approximate cost of goods...
Inside Mathematics
Rugs
The class braids irrational numbers, Pythagoras, and perimeter together. The mini-assessment requires scholars to use irrational numbers and the Pythagorean Theorem to find perimeters of rugs. The rugs are rectangular, triangular,...
Inside Mathematics
Scatter Diagram
It is positive that how one performs on the first test relates to their performance on the second test. The three-question assessment has class members read and analyze a scatter plot of test scores. They must determine whether...
Curated OER
"Sir Cumference and the First Round Table" by Cindy Neuschwander
Middle schoolers develop an understanding of measurable attributes of circles; develop a formula to determine the circumference of circles. They approximate the value of pi.
PBS
Working with Coordinate Planes: Assessments
It's time for scholars to show what they know about coordinate planes with a collection of three assessments. The exams' objectives include plotting points on a single grid, measuring using the distance formula, and identifying points on...
PBS
Working with Coordinate Planes: Activities and Supplemental Materials
Seven activities make up a collection of supplemental materials to reinforce graphing on a coordinate plane. Worksheet objectives include plotting coordinates within single and four quadrants, measuring straight and diagonal lines, and...
Mathematics Assessment Project
Matching Situations, Graphs and Linear Equations
What do guitars, candles, and helicopters have in common? They're all in this resource. Learners complete an assessment task to determine the amount of profit made in a guitar class based on given information regarding variable...
CK-12 Foundation
Applications of Linear Systems: Alcohol Solution in Nursing
Solve alcohol systems to find the right solution. The interactive allows pupils to manipulate the amount of a solution and displays the total amount in a mixture. Individuals determine the amount of each solution needed to make 15 liters...
Curated OER
What's Up With My Class
Students collect data about their class and they use Excel spreadsheet to display their tables and graphs about the class. They answer survey questions and collect their data. Students create a graph of their choice to display the...
Curated OER
Representation of Quadratic Functions
Students use a table, graph or equation to represent a quadratic function. In this algebra instructional activity, students model and graph with quadratic function. They become comfortable representing quadratics using different methods.
Curated OER
Modeling Linear Relationships
Students graph lines using the slope and y-intercept. In this algebra lesson, students create data using tables and equations. They use their data to make predictions and draw conclusion.
Curated OER
Investigating Velocity Effects at Takeoff
Students use, with increasing confidence, problem-solving approaches to investigate and explain mathematical content. They make and test conjectures. They use tables and graphs as tools to interpret expressions, equations, and inequalities.
Curated OER
Analyzing Discrete and Continuous Data in a Spreadsheet
You are what you eat! Your statisticians keep a log of what they eat from anywhere between a day to more than a week, keeping track of a variety of nutritional information using a spreadsheet. After analyzing their own data, individuals...
Shodor Education Foundation
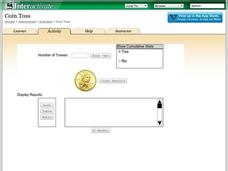
Coin Toss
Are your young mathematicians having a hard time making heads or tails of probabilities? It's no toss up—here is a resource that's sure to straighten them out! Learners run the interactive to toss a coin a different number of times....
American Statistical Association
Bear Hugs
Scholars research arm span to determine who gives the best bear hugs. They use data from a national study to find the standard statistics for arm span. It includes mean, median, quartiles, spread, standard deviation, and more.
American Statistical Association
Don't Spill the Beans!
Become a bean counter. Pupils use a fun activity to design and execute an experiment to determine whether they can grab more beans with their dominant hand or non-dominant hand. They use the class data to create scatter plots and then...
Mathematics Assessment Project
Representing and Combining Transformations
Transform your learners into master geometers with an activity that asks them to first complete an assessment task drawing the result after transformation of a given shape in the coordinate plane. They then use cards to represent...
Mathematics Assessment Project
Comparing Lines and Linear Equations
Scholars first complete an assessment task on writing linear equations to model and solve a problem on a running race. They then take part in a card matching activity where they match equations and graphs of lines to diagrams of fluid...
Curated OER
ESL General Knowledge Quiz 1- Fill in the Table
For this ESL general knowledge quiz worksheet, students answer 20 questions. They answer questions about bird, capital cities, money, countries, oceans, math, and geography. They are able to score 20 points by getting each answer correct.
Curated OER
Jo's Table
Students continue a sequential pattern using a partially filled in table and simple addition exercise. They use problem solving strategies such as guess and check, make a table, look for patterns. They discuss their finding with the class.


