Scholastic
Study Jams! Probability as a Fraction
Pick a card, any card... and then follow along with this step-by-step presentation as Sam from the Study Jams! crew determines what chance he has of drawing a jack from a deck of cards. This context serves to clearly model how fractions...
Visa
In Trouble
What are some of the financial risks associated with using credit? Pupils learn the warning signs of incurring financial hardship, and through PowerPoint presentations, worksheets, and discussion, discover the implications of such events...
Math Worksheets 4 Kids
Probability Worksheet
Your learners probably will enjoy practicing a variety of concepts as they work through these eight probability worksheets. The first few worksheets emphasize basic probability using cards, the months in a year, and the number of...
Balanced Assessment
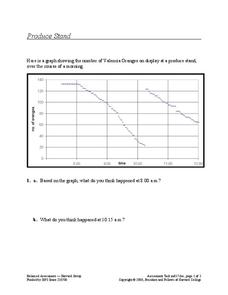
Produce Stand
Interpret a graph of the number of oranges at a produce stand to determine a likely event at different times. They also analyze the graph to determine which time period oranges were selling most quickly.
Federal Reserve Bank
Lesson 3: A Fresh Start
The members of your economics class may be busy earning graduation credits, but the credit they should be concerned about is their financial credit. The third lesson in a unit about Hurricane Katrina and other events that can result in...
EngageNY
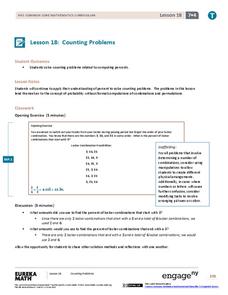
Counting Problems
Solving these percent problems is a matter of counting. Pupils find percents by counting the number of events that meet the criteria and the total number of possibilities. Participants create the ratio and convert it to a percent to...
Project Maths
Introduction to Probability
Take a chance with an activity sure to improve your class's skills. An introductory instructional activity focuses on probability and chance. It shows how probability is always a value between zero and one, i.e., the probability of an...
Curated OER
Mystery Spinners
Take a spin with probability. Given a set of clues about the probability of events on a spinner, groups create their own device to match the clues. Using a jigsaw strategy, groups share their spinners and strategies with other groups....
Bowland
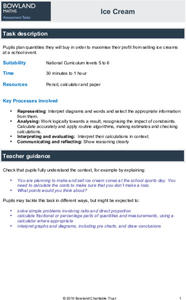
Ice Cream
Make sure there is enough ice cream on hand. Learners try to find out how much ice cream to buy for a sports event. Scholars use a pie chart showing the percent of a sample of people who like different flavors of ice cream. Using the...
Curated OER
My Life in Numbers
Have fun while your class creates a timeline of their lives. They record events before and after they were born on a line with 10 integer pairs consisting of one integer on each side of zero. Many extension activities can be done in...
Curated OER
And the Winner Is...
Students read the sports section of the daily newspaper to find daily totals of what countries have won medals and find articles to keep in their journal (notebook) on the different events and athletes. They then create a spreadsheet to...
Curated OER
Probability Of One Event
Middle schoolers investigate the concept of probability. They use example problems in order to measure the likelihood of various outcomes. The instructional activity includes dialogue to be used by the teacher during direct instruction....
Curated OER
Probability Two Events
Students investigating the concept of probability practice the concept using a variety of different example problems. The lesson plan is delivered in a question and answer format. The frequency of answers is recorded in a data table for...
Curated OER
Relating Graphs to Events
In this algebra worksheet, students identify the graph that goes with-the equation. They solve word problems using graphs. There are 4 problems with an answer key.
Education World
The African American Population in US History
How has the African American population changed over the years? Learners use charts, statistical data, and maps to see how populations in African American communities have changed since the 1860s. Activity modifications are included to...
Illustrative Mathematics
Heads or Tails
Heads! A great way to practice probability is to flip a coin in class. The provided data allows your mathematicians to predict the probability of heads in ten coin flips. Bring coins to class and allow your own trial of heads or tails....
Illustrative Mathematics
How Many Buttons?
Bring the class into the probability by having everyone count buttons on their shirts. Organize the data into the chart provided and chose different possibilities such as "female with one button" or "all middle schoolers with more than...
Curated OER
Probability - Explore and Tabulate
Upper elementary and middle schoolers explore the concept of probability. In this probability lesson, pupils flip coins and draw chips out of a bag to determine the likelihood of a particular outcome. They perform the experiments with...
Curated OER
What Is El Niño?
Students access information at remote sites using telecommunications, identify impacts by reviewing past El Ni??o events, make and use scale drawings, maps, and maps symbols to find locations and describe relationships.
Curated OER
Calculate Probability as a Fraction
Seventh graders solve 10 different problems that include determining the probability of various events described. First, they determine the probability that a marble drawn from a bad will be a specified color. Then, everyone determines a...
Curated OER
Countdown Challenge: Experimental Probability
In this probability worksheet, students compute the experimental probability of an event from given data. They give answers in fraction, decimal and percent form. Students compare the theoretical probability to the experimental...
Curated OER
Robot Rover
Students will work in teams of 2 to read and discuss a case study. In this probability lesson, students will learn the formula for finding the probability of two events occurring together. Students will learn the meaning of independent...
Curated OER
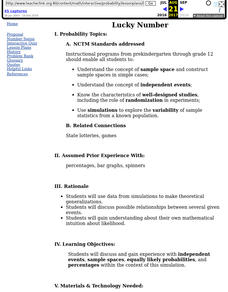
Lucky Number
Students use data from simulations to make theoretical generalizations. They discuss possible relationships between several given events and gain understanding about their own mathematical intuition about likelihood.
Curated OER
Here Comes The… Bill
Students share opinions about importance of milestone events they might host or attend. They then prepare estimated budgets for parties based on established budget totals, and compare their estimates against the real costs.
Other popular searches
- Current Events
- Sequence of Events
- Sequencing Events
- Compound Events
- Current Events Newspaper
- Field Day Events
- Chemistry Current Events
- Current Events Rubric
- Independent Events
- Teaching Current Events
- Africa Current Events
- Health Current Events


