Curated OER
Graphs that Represent Data Sets
These four scenarios all contain graphable data; can scholars match them to the correct bar graphs? All the data is in single-digit whole numbers. Some of the scenarios instruct kids to make a graph, while others don't. Clarify...
Curated OER
Graphs to Represent a Data Set
How many animals did Chaplin see at the zoo? Scholars examine three data sets and create a bar graph for each. Encourage them to label the different parts of their graphs, as this is not prompted on the worksheet. Once they finish their...
Curated OER
Graphs to Represent a Data Set
By analyzing a word problem about hours worked in a week, scholars get valuable practice with bar graphs and data analysis. They read the scenario, then examine a table of data taken from it. The data includes four days and the...
Curated OER
Graphs to Represent a Data Set
As your scholars begin to learn how to read graphs, help them pay attention to detail with this matching activity. They read four short data descriptions and match them to one of the four bar graphs pictured. Each graph is labeled along...
Curated OER
Graphs that Represent Data Sets
Use these pre-made data sets to introduce kids to bar graphs and data analysis, and then have them take surveys on their own. There are 10 survey scenarios written out here, and scholars synthesize the results of each into a bar graph....
Curated OER
Graphs to Represent a Data Set
Here are the number of animals Jackson saw at the zoo; scholars organize data into bar graphs using this worksheet. Encourage labeling, but consider having scholars do these on another sheet because there isn't room for the x-axis to be...
Curated OER
Data and Probability: What is the Best Snack?
In this math/nutrition lesson, the nutritional value of 3 snack foods is recorded on a data chart and represented on a bar graph. Students analyze and compare information, construct data charts and related bar graphs, and draw...
Curated OER
Graphs to Represent a Data Set
Here are a some pre-made sets of data that kids can use to practice data analysis. There are 10 survey scenarios written out, and scholars synthesize the results of each into a bar graph. In addition to the graphing, they answer two...
Curated OER
Graphs to Represent a Data Set
Here are Jack's hours for the week; scholars organize them into a bar graph in this data analysis learning exercise. They write the days along the y-axis and hours along the x-axis. Encourage labeling for this. Consider projecting as an...
Curated OER
Generate Measurement Data Word Problems
Beginning graphers will appreciate this practice with basic bar graphs. For each table of data, there is a corresponding graph for learners to match it to. The five data sets all have the same two factors: days and numbers. Although this...
Curated OER
Drive the Data Derby
Three days of race car design and driving through the classroom while guessing probability could be a third graders dream. Learn to record car speed, distances traveled, and statistics by using calculation ranges using the mean, median,...
Curated OER
Monstrous Data
Young scholars examine the meaning of data and data collection, represent data in various ways, and make a bar graph.
Scholastic
Study Jams! Mode
Sam is running for class treasurer and Zoe wants to know if he won the election. Follow along as she counts up the votes and uses the mode to determine the winner. After viewing the presentation, work through the Try It! practice...
California Education Partners
Colorful Data
Scale up your lessons with a performance task. Young data analysts work through an assessment task on scaled bar graphs. They answer questions about a given scaled bar graph on favorite colors, analyze a bar graph to see if it matches...
Curated OER
Generate Measurement Data Word Problems
Using a set of simple data, learners create a line plot to organize the information. This data includes only single-digit numbers and the highest number is six. Because the answer is explained and illustrated at the bottom, project this...
Curated OER
What Can Data Tell Us?
Young scholars analyze data they have collected themselves and by their classmates. In groups, they create data distributions to identify the highest, lowest and middle values. As a class, they discuss the concept of sample size and how...
Curated OER
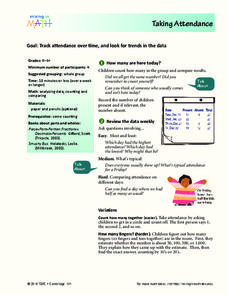
Taking Attendance
Young mathematicians record and analyze data. They will take attendance for their class and compare to other days. Then discuss ways to count who is present. They may also show the amount of students present using fractions.
Curated OER
Pictographs
What do these pictographs show? Scholars analyze three sets of data organized into pictographs, filling in several comprehension questions about each. The first one is done for them as an example, but consider going over it together to...
Curated OER
Interpreting Data from Birdfeeders
What kinds of birds live in your area? Read a book about birds to your learners and explore their feeding patterns. Charts and graphs are provided in this three page packet, but consider assigning the basic questions if using with young...
Curated OER
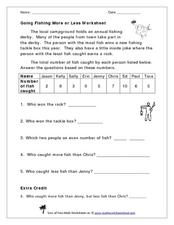
Going Fishing More or Less Worksheet
Take your class on a hypothetical fishing trip! This word problem gives a data set describing how many fish each of the nine contestants in a fishing derby caught. The numbers range from zero to ten. Learners examine the data and answer...
Curated OER
Button Bonanza
Collections of data represented in stem and leaf plots are organized by young statisticians as they embark some math engaging activities.
Curated OER
Reading Bar Graphs #2
Raise the bar in your third grade class with this learning exercise on bar graphs. Youngsters view three graphs representing three different sets of data, and answer questions based on what they analyze. The first set is completed as an...
DK Publishing
Using Information in Tables
Find out how well can your second or third graders use tables to solve word problems by assigning this single-page worksheet. Two tables with different sets of data prompt learners to solve six problems. An example at the top of the page...
Curated OER
Data Display
Students explore different ways to display data. In this statistics lesson, students create pie charts, bar graphs and line graphs to show data. Students then write a paragraph discussing which types of graphs are helpful for different...
Other popular searches
- Data Sets Data Collection
- Linear Data Sets
- Comparing Two Data Sets
- Quadratic Data Sets
- Data Sets and Graphs
- Compare Related Data Sets
- Experiments and Data Sets
- Correlation of Data Sets
- Create Data Sets
- Circle Graph Data Set
- Compare Data Sets
- Compare Two Sets of Data


