Willow Tree
Line Plots
You can't see patterns in a jumble of numbers ... so organize them! Learners take a set of data and use a line plot to organize the numbers. From the line plot, they find minimum, maximum, mean, and make other conclusions about the...
CK-12 Foundation
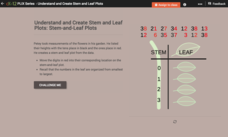
Understand and Create Stem-and-Leaf Plots: Stem-and-Leaf Plots
Explore the advantages to using a stem-and-leaf plot using an online lesson. Learners manipulate an animation to create a stem-and-leaf plot. They then calculate statistics for the data using their display. Guiding questions help them...
Shodor Education Foundation
Scatter Plot
What is the relationship between two variables? Groups work together to gather data on arm spans and height. Using the interactive, learners plot the bivariate data, labeling the axes and the graph. The resource allows scholars to create...
Curated OER
Halloween Point Plot
Practice graphing and plotting points with a festive Halloween flair! Scholars plot 21 points on a grid, connecting them to create a spooky shape!
CK-12 Foundation
Line Plots from Frequency Tables: Sleep Cycles
Demonstrate the ease of using a frequency table. An interactive lesson allows learners to create a frequency table efficiently. Challenge questions ask your classes to analyze the data represented in the frequency table.
Charleston School District
Constructing Scatter Plots
Having more letters in your name helps you get a better grade in your math class—or does it? Learners create scatter plots to organize data. The lesson places emphasis on determining scale and intervals and labeling axis.
Willow Tree
Scatterplots and Stem-and-Leaf Plots
Is there a correlation between the number of cats you own and your age? Use a scatter plot to analyze these correlation questions. Learners plot data and look for positive, negative, or no correlation, then create stem-and-leaf plots to...
Charleston School District
Analyzing Scatter Plots
Scatter plots tell a story about the data — you just need to be able to read it! Building from the previous lesson in the series where learners created scatter plots, they now learn how to find associations in those scatter plots....
CK-12 Foundation
Two-Sided Stem-and-Lead Plots: Gamers
Which gender spends more time playing video games? Your classes use provided data to answer this question. They first build a two-sided stem-and-leaf plot and then use the display to look for patterns. Guiding questions help them...
Curated OER
Custom Line Plot Worksheets
Do you need to create custom line plot worksheets for your math learners? Use this template to create the line plot. Include up to five questions below the plot.
CK-12 Foundation
Understand and Create Stem-and-Leaf Plots: Event Survey
A good lesson doesn't just grow on trees! Help your classes understand the concept of a stem-and-leaf plot using an interactive lesson. Learners first create a stem-and-leaf plot from a set of data by dragging the values to the...
CK-12 Foundation
Create and Understand Box-and-Whisker Plots: Babies in a Waiting Room
Explore the strengths and weaknesses of box-and-whisker data display. An interactive lesson asks learners to create a box-and-whisker plot from a set of data. Challenge questions focus on determining what types of conclusions they can...
Curated OER
Quiz: Reading and Making Line Plots
In this reading and making line plots worksheet, students create a line plot for given sets of numbers. In addition, they read graphs and interpret the average. This one-page worksheet contains ten problems.
Mathed Up!
Cumulative Frequency and Box Plots
Learn how to display data. Young data analysts watch a video to review how to create cumulative frequency histograms and box plots. They work on a set of questions to practice producing these data displays.
Texas Education Agency (TEA)
Archetypes, Motifs, and Plot in Drama (English II Reading)
The second interactive in a series of 10 introduces young scholars to character archetypes, archetypal plot patterns, and archetypal motifs, including the use of color. Learners read passages explaining the term and study examples from...
Flipped Math
Create and Analyze Graphs
Model the world with graphs. Pupils watch and participate in creating graphs to model real-world situations. The presenters stress the importance of a consistent scale and proper labels for the graphs along with identification of the...
Shodor Education Foundation
Box Plot
What information can come from a box? Learners choose a data set to display as a box plot and decide whether to include the median in the calculation of the quartiles, show the outliers, and change the scale. To finish the lesson,...
Willow Tree
Box-and-Whisker Plots
Whiskers are not just for cats! Pupils create box-and-whisker plots from given data sets. They analyze the data using the graphs as their guide.
CK-12 Foundation
Plots of Polar Coordinates: Submarine Sonar
Find the location of enemy submarines with a sonar display that doubles as a polar coordinate system. Pupils find polar coordinates that would be the same location of plotted submarines. They then determine multiple polar...
Statistics Education Web
How High Can You Jump?
How high can your pupils jump? Learners design an experiment to answer this question. After collecting the data, they create box plots and scatter plots to analyze the data. To finish the lesson, they use the data to draw conclusions.
Achieve
BMI Calculations
Obesity is a worldwide concern. Using survey results, learners compare local BMI statistics to celebrity BMI statistics. Scholars create box plots of the data, make observations about the shape and spread of the data, and examine the...
Curated OER
Line Plots - Homework 6.3
Elementary schoolers use data in a table to make a line plot, then answer five related questions. Houghton Mifflin text is referenced.
CK-12 Foundation
Understand and Create Line Graphs: Line Graphs
Explore line graphs and their characteristics through an interactive lesson. Scholars follow a set of directions to plot data on a line graph. They then answer questions about the type of variables, minimum and maximum values, and...
Frost Middle School
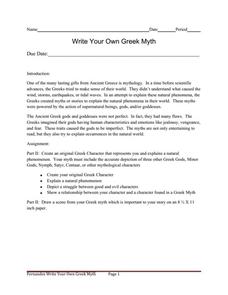
Write Your Own Greek Myth
Invite your pupils to create original Greek characters and myths for their characters to star in. Similar to a traditional Greek myth, the story must explain a natural phenomenon, depict a struggle between good and evil characters, and...


