Kenan Fellows
Least Squares Linear Regression in R
The task? Determine the how effective hospitals are at reducing the rate of hospital-acquired infections. The method? Data analysis! Using an open source software program, individuals use provided data and create scatterplots to look for...
NASA
A Different Perspective
What can we learn from the data? Young scholars analyze actual solar data to answer specific questions. The activity presents an opportunity for an open-ended investigation of the data to conclude a five-part series on solar winds.
EngageNY
Tides, Sound Waves, and Stock Markets
Help pupils see the world through the eyes of a mathematician. As they examine tide patterns, sound waves, and stock market patterns using trigonometric functions, learners create scatter plots and write best-fit functions.
NOAA
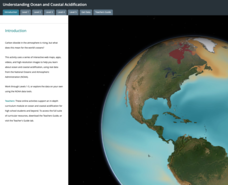
Ocean Acidification
Carbon dioxide is on the rise; does that also mean a rise in danger to humans and animals? Scholars learn what that means for the environment and more specifically the ocean. They examine data on the pH of different ocean areas and learn...
Messenger Education
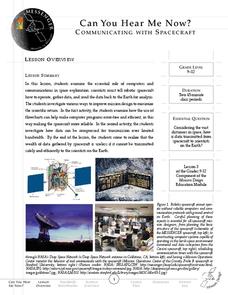
Can You Hear Me Now?—Communicating with Spacecraft
Radio signals transmitted to Pluto take five hours to reach their destination! In these two activities, young scientists explore data communication in space. In activity one, pupils learn how data is gathered and sent back to Earth....
EngageNY
Normal Distributions (part 1)
Don't allow your pupils to become outliers! As learners examine normal distributions by calculating z-scores, they compare outcomes by analyzing the z-scores for each.
CK-12 Foundation
Broken-Line Graphs: Heating Curve of Water
Examine the unique graphs coined broken-line graphs. Using the phase change of water for data, learners answer questions related to the temperature and energy at different times in the cycle of the phase change. Questions focus on the...
PBL Pathways
Tax Examination
What are your chances of being audited by the IRS? An engaging problem scenario asks pupils to examine the likelihood of being audited compared to factors such as receiving a refund or claiming a home office. The final product of...
Statistics Education Web
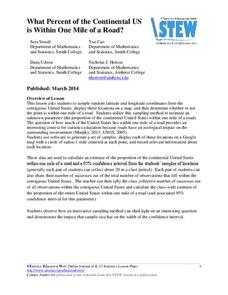
What Percent of the Continental US is Within One Mile of a Road?
There are places in the US where a road cannot be found for miles! The lesson asks learners to use random longitude and latitude coordinates within the US to collect data. They then determine the sample proportion and confidence interval...
Glynn County School System
Cosmology
The past, the present, and the future ... there's so much to discover about the galaxy. Scholars learn about the creation of the universe, its current structure, and how it is changing. The PowerPoint presentation begins with a...
Nature Works Everywhere
Sharks and Shorelines
Examine predator-prey marine relationships through an interactive lesson design. Learners begin by studying a specific shark species and then analyze real-time shark-tracking data. They also study threats to shark populations and...
Advocates for Human Rights
A Global Perspective on Immigration
To gain a global perspective on immigration, groups investigate and create a map of the migration patterns in Africa, Asia, Europe, Latin America, and the Middle East. Class members then examine the background, immigration history, and...
EngageNY
Modeling Riverbeds with Polynomials (part 2)
Examine the power of technology while modeling with polynomial functions. Using the website wolfram alpha, learners develop a polynomial function to model the shape of a riverbed. Ultimately, they determine the flow rate through the river.
PBL Pathways
Solar Toasters
Help a company maximize their profits! A detailed project-based learning activity examines two production scenarios. Your young scholars write a linear demand function. They then apply the function to develop a revenue, cost, and profit...
Columbus City Schools
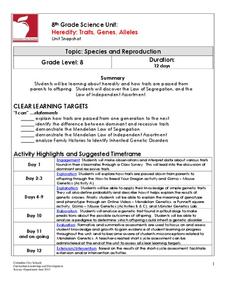
Heredity: Traits, Genes, Alleles
If you knew people would pay extra for a bald dragon, could you pick which parents you should breed in order to get the highest number? The unit examines heredity and genetics through breeding dragons, mice, dogs, and tries to figure...
University of Minnesota
What's the Deal? Addiction Card Game
Addiction is a big deal! Playing a game of cards helps learners understand the concept of addiction. Through their analysis, they examine the potential for addiction and how it varies for each individual.
Messenger Education
Exploring Solar Systems Across the Universe
Scientists have theorized that our solar system formed 4.6 billion years ago. In this pair of activities, learners first hypothesize how our solar system was formed. Using this information, groups then determine how scientists search for...


