Willow Tree
Line Plots
You can't see patterns in a jumble of numbers ... so organize them! Learners take a set of data and use a line plot to organize the numbers. From the line plot, they find minimum, maximum, mean, and make other conclusions about the data.
Curated OER
Data Collection and Presentation
Middle and high schoolers collect and analyze data from four different activities. The activities include information about classmates, tallying colors of cars in a parking lot, stem and leaf plots, and making a histogram from winning...
101 Questions
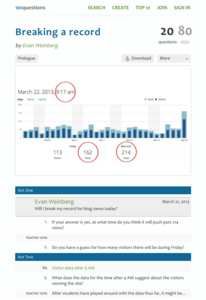
Breaking a Record
Can we break the record? Groups use provided data detailing the number of visitors to a blog to determine if the number of blog views breaks the previous record. They must take rates into consideration to make their estimates—a great...
Bowland
In the Olympics, are Women Improving Faster than Men?
Will the time come when women outperform men at the Olympic Games?Scholars investigate gender differences in Olympic Games performances. They study the historical participation of women and then analyze data to determine if women will...
US Department of Commerce
How Does Our Class Compare?
Compare the class to the country. As a group, pupils collect data on the types of activities boys and girls do after school. Learners compare the number of girls to the number of boys for each activity. Using census data, individuals...
Literacy Design Collaborative
Student-Determined Data Analysis
You can't argue with the numbers. Scholars complete activities to prepare for writing a data analysis report. Writers select a research topic and complete a data analysis tool. They share their questions based on the data with peers and...
Willow Tree
Scatterplots and Stem-and-Leaf Plots
Is there a correlation between the number of cats you own and your age? Use a scatter plot to analyze these correlation questions. Learners plot data and look for positive, negative, or no correlation, then create stem-and-leaf plots to...
Statistics Education Web
Did I Trap the Median?
One of the key questions in statistics is whether the results are good enough. Use an activity to help pupils understand the importance of sample size and the effect it has on variability. Groups collect their own sample data and compare...
PBL Pathways
College Costs 2
What is the financial benefit for attending a community college for the first two years before transferring to a four-year college? The second part of the educational lesson asks young scholars to explore this question through data...
Curated OER
Organizing Data
In this organizing data worksheet, 7th graders solve seven different types of problems related to data. They first identify the type of data as categorical, discrete or continuous from the information given. Then, students use Excel to...
Curated OER
Representing Data
Second and third graders answer questions based on data presented to them in graphs. They see how to interpret data from a bar graph, line graph, and a chart.
EngageNY
Modeling a Context from Data (part 1)
While creating models from data, pupils make decisions about precision. Exercises are provided that require linear, quadratic, or exponential models based upon the desired precision.
Curated OER
Inside OKCupid: The Math of Online Dating
Capture the hearts of your young statisticians with this real-life example of using statistics in online dating. The use of average and geometric mean are discussed in the context of creating the algorithm used to connect people.
Curated OER
Twelve Days of Christmas--Prediction, Estimation, Addition, Table and Chart
Scholars explore graphing. They will listen to and sing "The Twelve Days of Christmas" and estimate how many gifts were mentioned in the song. Then complete a data chart representing each gift given in the song. They also construct...
EngageNY
Understanding Variability When Estimating a Population Proportion
Estimate the proportion in a population using sampling. The 20th installment in a series of 25 introduces how to determine proportions of categorical data within a population. Groups take random samples from a bag of cubes to determine...
California Academy of Science
California's Climate
The United States is a large country with many different climates. Graph and analyze temperature and rainfall data for Sacramento and Washington DC as you teach your class about the characteristics of Mediterranean climates. Discuss the...
EduGAINs
Data Management
Using a carousel activity, class members gain an understanding of the idea of inferences by using pictures then connecting them to mathematics. Groups discuss their individual problems prior to sharing them with the entire class. The...
Curated OER
Pick A Number
Elementary schoolers find out which month has the most class birthdays (mode) and which birthday represents the middle point of all the birthdays (median). They gather and organize data to find one number that fairly represents the whole...
EngageNY
Evaluating Reports Based on Data from a Sample
Statistics can be manipulated to say what you want them to say. Teach your classes to be wise consumers and sort through the bias in those reports. Young statisticians study different statistical reports and analyze them for misleading...
Curated OER
Figure This! Math Challenges for Families
Young mathematicians complete a family math challenge packet. They will complete a packet of mixed math activities. They work with graphs, comparing numerical data, tessellations, and probability.
American Statistical Association
Candy Judging
Determine the class favorite. The statistics lesson plan has pupils collect, display, and analyze data. Pairs rank four kinds of candy based on their individual preferences. Working as an entire class, learners determine a way to display...
Laying the Foundation
Box-and-Whisker Plots
Statistics is made approachable, and dare we say fun, in this activity on using box-and-whisker plots to analyze and compare data sets. Specific emphasis is placed on interpretations and explanations while graphing, and in using the...
Corbett Maths
The Range
Spread the data out on the range. The short video provides a definition of the range. Using a data set of five numbers, the resource calculates the range.
Benjamin Franklin High School
Saxon Math: Algebra 2 (Section 3)
In this third of a twelve-part series, the focus moves from using matrices to solving systems of equations with substitution and elimination, including more than two dimensions and variables in equations, and analyzing statistical data....
Other popular searches
- Math Data Interpretation
- Math Analyzing Data
- Data/math Literature
- Math and Data Management
- Math Lesson Data Management
- Math Data
- Mathematics Chance and Data
- Math Lessons Organizing Data
- Math Data Collecting
- Math Bivariate Data
- Math/data Mean Mode Median
- Math Data Analysis


