Regression Analysis Teacher Resources
Hi, What do you want to do?
Find Regression Analysis lesson plans and worksheets
Showing 398 resources
Curated OER
Linear and Exponential Models
Students linearize data to determine if an exponential model is suitable. In this linearizing data to determine if an exponential model is suitable lesson, students graph the residuals of sets of data that appear to have an exponential...
Texas Instruments
Making Predictions Using Systems of Equations
Students explore the concept of systems of equations. In this system of equations instructional activity, students enter data into lists on their calculators about 100 meter dash times. Students plot the points using a scatter plot and...
Curated OER
Shake It Up with Scatterplots
Students identify how to use a scatterplot to compare two sets of data to determine if they are related. Then they identify and describe the definition of regression line (the "line of best fit"). Students also identify how scientists...
Curated OER
Let's Gather Around the Circle
Scholars explore the relationship between circumference and diameter. Groups of learners measure the diameter and circumference of round objects and record their data on a given worksheet. They then input the data into their graphing...
Virginia Department of Education
Exponential Modeling
Investigate exponential growth and decay. A set of six activities has pupils collecting and researching data in a variety of situations involving exponential relationships. They model these situations with exponential functions and solve...
Kenan Fellows
Lego Thinking and Building
Run a simulated airplane manufacturing plant with your pupils as the builders! Learners build Lego airplane models and collect data on the rate of production, comparing the number produced to the number defective. Using linear...
Curated OER
Population Dilemma
Ninth graders explore population growth. In this Algebra I activity, 9th graders conduct an experiment simulating population growth. Students create a model and relate the results to a real-world situation. ...
Crash Course
ANOVA: Crash Course Statistics #33
How do you account for multiple variables when analyzing data? Following a lesson on regression, the 33rd lesson in the Crash Course Statistics series examines the ANOVA, analysis of variances, method of determining differences...
Intel
What Does This Graph Tell You?
What can math say about natural phenomena? The fifth STEM lesson in this project-based learning series asks collaborative groups to choose a phenomenon of interest and design an experiment to simulate the phenomenon. After collecting...
Kenan Fellows
Density
Most scholars associate density with floating, but how do scientists determine the exact density of an unknown liquid? The third lesson in a seven-part series challenges scholars to find the mass and volume of two unknown liquids. Each...
PBL Pathways
Do Homework?
To complete homework or not to complete homework ... that is the question. Decide whether it makes a difference on finals by doing homework. Individuals create a scatter plot and find a line of best fit for data on the percent of...
Crash Course
Supervised Machine Learning: Crash Course Statistics #36
Use math to help predict the future. Viewers of the 36th Crash Course video covering statistics hear about machine learning. They see how logistic regression, linear discriminant analysis, and K nearest neighbors are all models that help...
Teach Engineering
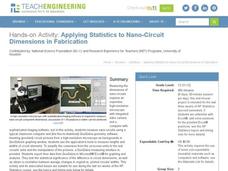
Applying Statistics to Nano-Circuit Dimensions in Fabrication
Do flexible circuits change dimensions during fabrication? Groups use GeoGebra software to measure the length of pictures of flexible nano-circuits. To determine if the circuits change dimensions, future engineers use Microsoft...
Curated OER
When the Snow is as High as an Elephant
High schoolers study the concept of mean values using a data plot. Learners enter the given data in the activity to create their data table. They use the data table to calculate the mean of the snowfall percentage provided in the...
Curated OER
Scatterplots and Regressions
In this scatterplots and regressions worksheet, students solve 6 different types of problems related to graphing scatterplots and interpreting regressions. First, they create a scatterplot from the given data coordinates and then,...
Curated OER
Scatter Plots
In this statistics activity, 11th graders analyze different scatter plot graphs for positive, negative and no correlation. They graph their data and analyze it using scatter plots.There is 1 question with an answer key.
Curated OER
Scatter Plots
Seventh graders investigate how to make and set up a scatter plot. In this statistics lesson, 7th graders collect data and plot it. They analyze their data and discuss their results.
Curated OER
Quadratic Regression Lab
Students use real temperature data from the Chesapeake Bay, to begin to see some natural mathematical phenomena, and to begin to interpret the data mathematically.
Community Partnerships for Adult Learning
Goals Setting
You can reach your goals, if you're SMART about it! Teach your class to how build specific goals that include all the elements of the acronym SMART. The plan includes detailed procedures for the teacher and requires pupils to...
College Board
2004 AP® Statistics Free-Response Questions Form B
Over the years, data analysis has been important. Looking back to the 2004 AP® Statistics Form B free-response questions, pupils and teachers see the importance of analysis of data sets. The six questions contain analysis of data on...
EngageNY
Modeling with Polynomials—An Introduction (part 2)
Linear, quadratic, and now cubic functions can model real-life patterns. High schoolers create cubic regression equations to model different scenarios. They then use the regression equations to make predictions.
Radford University
How Is Your Gender Represented?
Does the media shape people's views on gender? Scholars use data on gender portrayal in magazines to explore the idea. They use a spreadsheet program to create bar graphs and perform a chi-square test. They also use provided data to...
College Board
1998 AP® Statistics Free-Response Questions
Free-response questions form the 1998 AP® Statistics exam allow class members to analyze data from real-life situations. The situations include tracking defective parts, tracking butterflies, evaluating weed killers and determining...
PBL Pathways
Total Cost to Produce the Turbo Blender
Class members blend their knowledge of functions and problem-solving skills to provide business advice to the Turbo Blender manufacturers. Through a project-based approach, learners examine marginal cost data to produce a function....


