Graphing Linear Equations Teacher Resources
Hi, What do you want to do?
Find Graphing Linear Equations lesson plans and worksheets
Showing 498 resources
EngageNY
Graphs of Functions and Equations
Explore the graphs of functions and equations with a resource that teaches scholars how to graph functions as a set of input-output points. They learn how the graph of a function is the graph of its associated equation.
EngageNY
Mid-Module Assessment Task: Grade 8 Module 4
Determine what the class knows about linear equations. The three-question mid-module assessment is segment 15 in a 33-part series. The assessment includes writing and solving one-variable linear equations and graphing proportional...
EngageNY
End-of-Module Assessment Task: Grade 8 Module 4
Connect proportional linear equations and systems. The seven-question assessment is the last installment in a 33-part series. The items cover comparing proportional relationships, slope concepts, and simultaneous linear...
Mathematics Assessment Project
Matching Situations, Graphs and Linear Equations
What do guitars, candles, and helicopters have in common? They're all in this resource. Learners complete an assessment task to determine the amount of profit made in a guitar class based on given information regarding variable...
West Contra Costa Unified School District
Multiple Representations of Equations
class members first work through finding the equation, table of values, graph, and key features of a linear function expressed verbally. Individuals then work through several more problems given different representations.
CK-12 Foundation
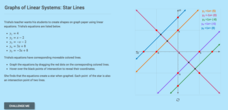
Graphs of Linear Systems: Star Lines
Let the class stars shine. Using four given linear equations, scholars create a graph of a star. The pupils use the interactive to graph the linear systems and determine the points of intersection. Through the activity, classmates...
EngageNY
Constant Rate
Two-variable equations can express a constant rate situation. The lesson presents several constant rate problems. Pupils use the stated constant rate to create a linear equation, find values in a table, and graph the points. The resource...
Mathispower4u
Graph a Linear Equation in General (Standard) Form
It's a straight line to understanding linear equations. Given a linear equation in standard form, scholars write the equation in slope-intercept form, identify the y-intercept, and use the slope to graph the line. An instructional video...
West Contra Costa Unified School District
Graphing Family of Functions
Functions have families, too. Learners first graph the parent functions for linear, quadratic, and cubic functions, and then use vertical translations to graph families of functions.
Corbett Maths
Drawing Graphs Using Gradient and Intercept
Help mathematicians see lines from equations as they learn the patterns in the equations. An instructional video describes the steps to graphing a linear function. All equations begin in slope-intercept form and result in a line with...
EngageNY
Constant Rates Revisited
Find the faster rate. The resource tasks the class to compare proportional relationships represented in different ways. Pupils find the slope of the proportional relationships to determine the constant rates. They then analyze the...
EngageNY
Vectors and the Equation of a Line
Represent linear equations in both two and three dimensions using parametric equations. Learners write parametric equations for linear equations in both two and three variables. They graph and convert the parametric equations to...
Concord Consortium
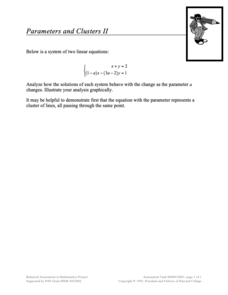
Parameters and Clusters II
Let's give parameters a second try. Scholars take a second look at a system of linear equations that involve a parameter. Using their knowledge of solutions of systems of linear equations, learners describe the solution to the system as...
Mathematics Assessment Project
Shelves
Don't leave this task on the shelf — use it is assess middle schoolers understanding of patterns. Participants try to discover a pattern in the number of bricks and planks used to make shelves. They then match descriptions...
National Education Association
Define the Effects of Parameter Changes on Graphs of Linear Functions
Parameters can move and change the steepness of a graph. Introduce the effects of changing the slope or the y-intercept of a linear graph. The resource shows how to incorporate changes on graphs and how they will move up, move down,...
EngageNY
There is Only One Line Passing Through a Given Point with a Given Slope
Prove that an equation in slope-intercept form names only one line. At the beginning, the teacher leads the class through a proof that there is only one line passing through a given point with a given slope using contradiction. The 19th...
Mathispower4u
Graph a Linear Equation in Slope-Intercept Form (Example 1)
Plot a course to learn about plotting linear equations. By watching a short instructional video, pupils learn how to graph a linear equation given in slope-intercept form. The example in the video involves a positive slope and a positive...
Mathispower4u
Solve a System of 2 Equations with 2 Unknowns by Graphing on the TI84 (Example)
Let the technology do the graphing. Learners watch a helpful algebra video that shows how to use a graphing calculator to solve a system of linear equations. The presentation works through one example using a TI-84 to solve a system and...
West Contra Costa Unified School District
Discovering Slope of a Line in Standard Form
From start to finish this skills practice resource provides a way for individuals to explore the standard form equation of a line. Begin with a warm-up, work through the problems, and then discover the relationship between the...
Concord Consortium
Parameters and Clusters I
Chase the traveling solution. Pupils analyze the solutions to a system of linear equations as the parameter in one equation changes. Scholars then use graphs to illustrate their analyses.
Rice University
Algebra and Trigonometry
Move on into trigonometry. An informative eBook takes the content of a College Algebra course and adds more relating to trigonometry and trigonometric functions. The content organization allows pupils to build upon their learning by...
Curriculum Corner
8th Grade Math "I Can" Statement Posters
Clarify the Common Core standards for your eighth grade mathematicians with this series of classroom displays. By rewriting each standard as an achievable "I can" statement, these posters give students clear goals to work toward...
Radford University
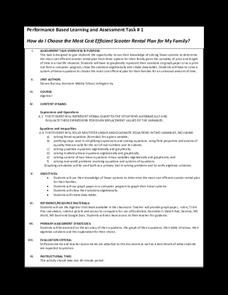
How do I Choose the Most Cost Efficient Scooter Rental Plan for My Family?
Pupils compare the cost of renting scooters for a family vacation from three different rental places. To help make their decision, scholars create tables, equations, and graphs of the pricing structure. Individuals then determine which...
EngageNY
End-of-Module Assessment Task: Grade 8 Module 5
Give your class a chance to show how much they've learned in the module with an end-of-module assessment task that covers all topics from the module including linear and non-linear functions and volumes of cones, cylinders, and...
Other popular searches
- Algebra Graphing Lines
- Graphing Lines Quilt Pattern
- Linear Equations and Graphing
- Linear Equations Graphing
- Pre Algebra Graphing Lines
- Area Graphing Lines
- Ged Graphing Lines


