Curated OER
Algebra 2 Test
In this algebra instructional activity, 11th graders test their knowledge of functions and slopes. They solve equations and identify functions, find the inverse and find the equation of parallel and perpendicular lines. There are 21...
Curated OER
Chapter 2 Practice Test
In this algebra learning exercise, students examine and graph linear equation, inequalities, and absolute value inequalities in two variables. The three page learning exercise contains forty-six problems. Answers are not...
Curated OER
Graphing Rational Functions
In this algebra worksheet, 11th graders graph rational functions. They identify the asymptote, discontinuity, holes and vertex. There are 14 questions with an answer key.
Curated OER
Graphs of Functions
In this algebra worksheet, 11th graders graph functions and identify properties of each functions. They find the domain and range, along with the asymptote. There are 4 questions on this worksheet.
Curated OER
Algebra I - Worksheet G12: Graphing Lines
In this graphing lines worksheet, high schoolers graph 28 lines given various data. Students graph lines given two points, a point and slope, and a line perpendicular or parallel to a point.
Curated OER
Lines of Fit
Students analyze graphs. In this algebra lesson plan, students find the line of best fit, using scatter plots. They calculate the sale of popcorn as it relates to the price. They then analyze the graphs for positive, negative and no...
Mt. San Antonio Collage
Test 2: Rationals, Exponentials, and Logarithms
Running out of logarithm questions in class? The nicely organized two-page worksheet provides practice in rational, logarithmic, and exponential functions. All the topics include graphing, solving, and finding domain and range.
Curated OER
Applying Properties to Variables
Eighth graders combine like terms in this properties of variables lesson. Using named items (stars, moons and hearts), they combine like terms using variables. They use the distributive property to combine like terms. Finally, they write...
Mt. San Antonio Collage
Graphs of Rational Functions
Sometimes graphing rational functions can feel a little "irrational." Starting with the basics, learners work their way through the pieces of these graphs and finish off with an application question.
Mathematics Vision Project
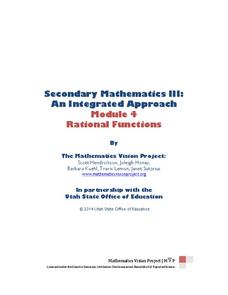
Module 4: Rational Functions
Time to study the most sensible function — rational functions! The seven-lesson unit develops the concept of a rational function through a connection to rational numbers and fractions. Scholars graph functions, solve equations, and...
BW Walch
Creating and Graphing Linear Equations in Two Variables
This detailed presentation starts with a review of using key components to graph a line. It then quickly moves into new territory of taking these important parts and teasing them out of a word problem. Special care is...
Cloud Front
Direct Variation Worksheet
Direct variation can be applied to many problems and here is a worksheet that has learners practicing them all. The skills include graphing, finding proportional relationships, and solving word problems to show how different factors...
Inside Mathematics
Graphs (2007)
Challenge the class to utilize their knowledge of linear and quadratic functions to determine the intersection of the parent quadratic graph and linear proportional graphs. Using the pattern for the solutions, individuals develop a...
Inside Mathematics
Sorting Functions
Graph A goes with equation C, but table B. The short assessment task requires class members to match graphs with their corresponding tables, equations, and verbalized rules. Pupils then provide explanations on the process they used to...
Curated OER
Graphing Inequalities in Two Variables
This study guide is a great resource to help you present the steps to graphing linear inequalities. Show your class two different ways to graph an inequality and work on a real-world example together. The document could also be easily...
Willow Tree
Approximating a Line of Best Fit
You may be able to see patterns visually, but mathematics quantifies them. Here learners find correlation in scatterplots and write equations to represent that relationship. They fit a line to the data, find two points on the line, and...
Mt. San Antonio Collage
Exponential and Logarithmic Functions
High schoolers grow their skills exponentially after completing this thorough worksheet. Going from simple to difficult, it hits all the major skills regarding exponential and logarithmic functions including simplifying, solving,...
Curated OER
Systems of Equations: What Method Do You Prefer?
Young scholars explore the concept of solving systems of equations. In this solving systems of equations lesson, students watch YouTube videos about how to solve systems by graphing and by elimination. Young scholars use an interactive...
Curated OER
What Functions do Two Graph Points Determine?
Your algebra learners write linear, exponential, and quadratic equations containing the same two graph points in this collaborative task.
Curated OER
How Long Can You Go?
Eighth graders examine the usefulness of a line of best fit by collecting and graphing data, using a graphing calculator to determine the line of best fit, and making a variety of predictions. They watch a video, then design a...
101 Questions
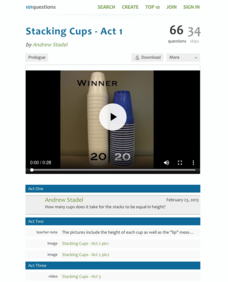
Stacking Cups
Facilitate an understanding of equality using a modeling task. After watching different-sized cups being stacked, learners use their math skills to determine when the height of each cup tower will be the same. Meant as an introduction to...
College Board
Random Variables vs. Algebraic Variables
Variables can vary in meaning. A reference material for AP® Statistics explains the difference between random and algebraic variables. It provides a hypothetical situation involving dice—great for use in a classroom situation.
Inside Mathematics
Graphs (2004)
Show your pupils that perimeter is linear and area is quadratic in nature with a short assessment task that requests learners to connect the graph and equation to a description about perimeter or area. Scholars then provide a...
Illustrative Mathematics
Chicken and Steak, Variation 2
Many organizations put on barbecues in order to make money. In a real-world math problem, the money allotted to purchase steak and chicken at this barbecue is only one hundred dollars. It is up to your potential chefs to figure out how...
Other popular searches
- X and Y Intercepts
- Finding X and Y Intercepts
- X and Y Intercepts
- X & Y Intercepts
- X and Y Intercepts
- Graph Using X and Y Intercepts
- Finding the X and Y Intercepts
- X Y Intercepts Graphing
- X Y Intercepts
- Graph X and Y Intercepts
- Graphing X and Y Intercepts
- X and Y Intercepts


