West Contra Costa Unified School District
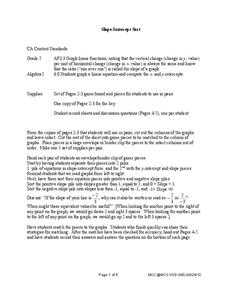
Slope-Intercept Sort
What's so special about slope? Pupils first match cards with slope and y-intercept to graphs of linear equations. They continue the lesson by matching equations in slope-intercept form to the same graphs.
Curated OER
Going Back to Your Roots
Investigate the Fundamental Theorem of Algebra and explore polynomial equations to determine the number of factors, the number of roots, and investigate multiplicity of roots.
Virginia Department of Education
Rational Functions: Intercepts, Asymptotes, and Discontinuity
Discover different patterns by making connections between a rational function and its graph. An engaging lesson plan asks scholars to explore the behavior of different rational functions. Groups discover a connection between the...
Concord Consortium
Function Project
What if a coordinate plane becomes a slope-intercept plane? What does the graph of a linear function look like? Learners explore these questions by graphing the y-intercept of a linear equation as a function of its slope. The result is a...
West Contra Costa Unified School District
Comparing Linear and Quadratic Functions
If a linear function and a quadratic function enter a boxing match, which one would win? Learners first review how to find key features of linear and quadratic functions. Next, they compare key features of pairs of functions.
West Contra Costa Unified School District
Key Features of Graphs
The key is ... After a day of instruction on key features of graphs, groups create a poster and presentation on the key features of their given function graph. The resource provides an extension activity of "telephone" using...
West Contra Costa Unified School District
Three Forms of an Equation of a Line
An equation is an equation is an equation. Scholars see there are many ways to solve them when they first sort a set of linear equations as written in standard form, point-slope form, or slope-intercept. They then write equations in all...
Flipped Math
Quadratics in Standard Form
Get ready to set the standard! Pupils watch a video on how to graph a parabola from a quadratic in standard form without converting the form. Scholars learn how to find the axis of symmetry from the equation and from there the vertex....
Curated OER
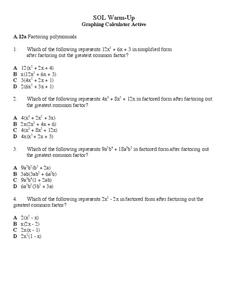
Factoring Polynomials
In this factoring polynomials worksheet, 9th graders solve and complete 33 different multiple choice problems. First, they determine the equation that best represents a simplified form after factoring out the GCF. Then, students...
Virginia Department of Education
Factoring for Zeros
Relate factors to zeros and x-intercepts. Scholars first graph quadratics in both standard and factored forms to see that they are the same. They go on to use the graphs to see the relationship between factors and x-intercepts.
West Contra Costa Unified School District
Graphing Systems
Get hands on with solving systems of equations graphically. A solid lesson plan uses guided practice to show how to solve systems of linear equations. It allows time for sharing ideas and provides a printable matching activity...
Virginia Department of Education
Slope-2-Slope
Pupils build on previous experience with slope to investigate positive, negative, zero, and undefined slope. They complete a puzzle matching slope-intercept and standard forms of linear equations.
Mt. San Antonio Collage
Test 1: Functions and Their Graphs
Save the time creating an assessment because these function problems should do the trick. With 10 multi-part questions, they each focus on a different topic including radical, polynomial, linear and piecewise functions. The majority of...
Raytheon
Equations and Graphing Review
In this equations and graphing review instructional activity, learners write, graph and solve equations for 62 problems, including a mid-unit review, with answers included.
Curated OER
Graphing Linear Equations Cards
OK, so maybe graphing linear equations can be fun. This activity includes a set of linear equation cards to be cut and place face up on a table. Learners pick a card and match it to the correct graph card. This is a really fun way to...
Curated OER
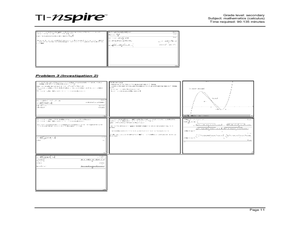
Two Investigations of Cubic Functions
Through learning about cubic functions, high schoolers graph cubic functions on their calculator. Students determine the local maximum and minimum points and the tangent line from the x-intercept to a point on the cubic...
West Contra Costa Unified School District
Solving a System by Substitution
Solving systems by substitution can be a challenging topic in algebra I. Here is a lesson that builds on students' understanding of intercepts to begin the process of substitution, and all work is reinforced graphically to build...
Curated OER
Exploring Slope
In this exploring slope worksheet, students solve and complete 4 different problems. First, they compare an object's weight on Earth to an object's weight on another planet using the information given. Then, students compare this...
Curated OER
Graphing Linear Functions
In this linear functions worksheet, 9th graders solve and complete 30 different multiple choice problems that include graphing. First, they determine the expression that is equivalent to the given expression. Then, students determine the...
Illustrative Mathematics
Graphs of Quadratic Functions
The equations look different, but their graphs are the same. How can that be? This activity leads your mathematicians in an exploration of three different forms of the same quadratic function. After comparing the equations, their graphs,...
West Contra Costa Unified School District
Point-Slope Application Problems
Create a linear equation for a problem when the intercept information is not given. The two-day lesson introduces the class to the point-slope form, which can be used for problems when the initial conditions are not provided. Pupils...
National Council of Teachers of Mathematics
Stitching Quilts into Coordinate Geometry
Who knew quilting would be so mathematical? Introduce linear equations and graphing while working with the lines of pre-designed quilts. Use the parts of the design to calculate the slope of the linear segments. The project...
Illustrative Mathematics
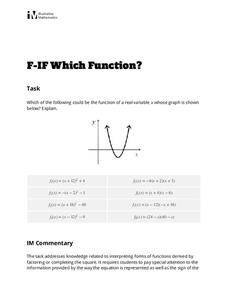
Which Function?
Learners are given a graph of a parabola on a coordinate system, but intercepts and vertex are not labeled. The task is to analyze eight given quadratic functions and determine which ones might possibly be represented by the graph. The...
Virginia Department of Education
Factors, Zeros, and Solutions
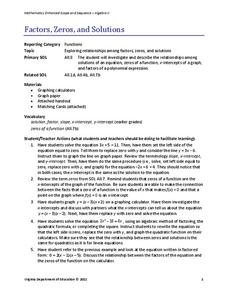
Factors, zeros, and solutions, oh my! Don't let your classes become overwhelmed with the vocabulary. An engaging instructional activity helps learners make a connection between factors, zeros, and solutions. Pupils explore the...
