Curated OER
Filling Up
In this filling up worksheet, students calculate the E85 per gasoline-gallon equivalent price to the E85 price per gallon to complete a chart of "alternative fuel". They use the data along with the price per gallon of gasoline to plot...
Curated OER
Tech Algebra: A Statistics Study
Students use the internet to gather a minimum of thirty pieces of data. Students create box and whisker graphs, and stem and leaf plots from the information. They calculate mean, median, mode, and range. Students write a summary and...
Curated OER
Tsunami Simulation Experiment
Pupils examine an article about tsunami warning systems and discuss why they are important. They conduct an experiment that shows how the velocity of a wave in water changes with the depth.
Texas State Energy Conservation Office
Investigation: Insulation
Youngsters compare the heat-holding abilities of three different cans by insulating two with different materials and measuring the temperature change of hot water over a 20-minute period.
Teach Engineering
Maximum Power Point
Investigate the maximum power output of a photovoltaic panel with a instructional activity that introduces the class to the maximum power point. Individuals learn how to determine the maximum power point of a solar panel by using Ohm's...
Mathematics Vision Project
Module 6: Congruence, Construction, and Proof
Trace the links between a variety of math concepts in this far-reaching unit. Ideas that seem very different on the outset (like the distance formula and rigid transformations) come together in very natural and logical ways. This...
PBS
Blow the Roof Off!
Blow the minds of young scientists with this collection of inquiry-based investigations. Based on a series of eight videos, these "hands-on, minds-on" science lessons engage young learners in exploring a wide range of topics...
Science Geek
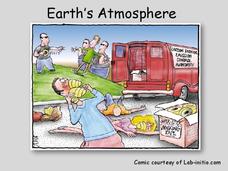
Earth's Atmosphere
Ozone gas absorbs the harmful UV-B rays and helps protect humans. An informative presentation begins with the layers of the earth's atmosphere, the pressure and temperature in each of the layers, the ozone layer, the ozone cycle,...
Curated OER
Tracking the Storm
Students discuss the different types of storms that can hit land. They locate specific coordinates on a plane grid. They discuss lonsgitude and latitude to plot the coordinates of a tropical storm. They practice finding coordinates...
Curated OER
How Much Water Is Available In The Atmosphere For Precipitation?
Students explore the relationship between the available water in the atmosphere and how it is portrayed on satellites. After examining global moisture and precipitation students research precipitation data graph the results. Using their...
Curated OER
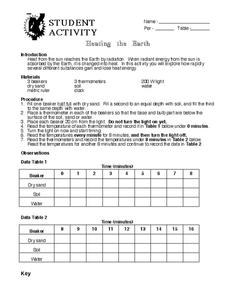
Heating The Atmosphere
In this science worksheet, students look for the answers to finding the correct temperatures that match the location in the atmosphere.
Curated OER
Earth Science: travel
For this earth science worksheet students complete a series of multiple choice and short answer questions that includes solar radiation, temperature, porosity and rock formations.
Curated OER
Tracking Weather Over Time
Young scholars gather, analyze and interpret data. They explain scientific inquiry. They plot points on a map and report information from a spatial perspective.
Curated OER
Comparing Temperature, Pressure, and Humidity
Students investigate data on temperature, pressure, and humidity by downloading information from the ARM Website. Working in groups, they discover how weather impacts life in each of the ARM sites. They record weather data in their...
Curated OER
Blowin' In The Wind
Students predict and hypothesize the reasons for wind movement. After viewing a video, they describe the effects of a high and low pressure system and what makes the wind blow. In groups, they construct instruments that measure air...
Curated OER
Seasons
Students explore the four seasons. Through observation activities, they explore and discuss the weather changes that occur during each season. Students create a graph of the clothing that is worn during each season.
Curated OER
Introducing Temperature Measurement
Students explore temperature and use Celcius thermometers to measure and graph the temperature in the classroom daily. They estimate what they think the temperature might be and then find the actual temperature in the room.
Curated OER
Eyewitnesses to Change
Students explore recent changes in the Artic's climate that have been observed by Artic residents. They watch videos, take notes and create a concept map. They also look at historical weather data from a specific Artic community. The...
Curated OER
Investigating Median, Mode, and Mean
Students develop strategies to organize data while following teacher demonstration. They calculate the mean, median and mode of a data set while determining the relationships between the numbers. They analyze data from tables and double...
Curated OER
Evaporation
First graders explore, analyze, document and study weather and the water cycle. They observe the weather and begin a weather journal. Each student interacts with the concepts of evaporation, condensation and precipitation, clouds,...
Curated OER
Probability With a Random Drawing
Students define probability, and predict, record, and discuss outcomes from a random drawing, then identify most likely and least likely outcomes. They conduct a random drawing, record the data on a data chart, analyze the data, and...
Curated OER
Farming: Natural Resources (Lesson 2)
Students identify the types of natural resources. They explain the difference between weather and climate. They practice using a rain gauge and reading a thermometer.
Curated OER
Climate Systems - Which Location Is Best For Me?
Students study the difference between weather and climate. In this climate systems lesson students search the Internet for the parts of the Earth's system, gather climate data and complete a challenge scenario.
Curated OER
Linking Algebra to Temperature
Young scholars convert between two units as they calculate the temperature. In this algebra instructional activity, students collect data on seasonal climate and create a graph. They make conjectures based on their data collection.
Other popular searches
- Kindergarten Weather Graph
- Fall Weather Graph
- Daily Weather Graph
- Culture Weather Graph
- Graph Weather Chart
- Graphing Weather
- Graph Weather
- Graphing Weather Data
- Graphing Weather Activity
- Graphing the Weather
- Weather Graphs and Charts
- Weather Graph Template


