Illustrative Mathematics
Weather Graph Data
Teaching young mathematicians about collecting and analyzing data allows for a variety of fun and engaging activities. Here, children observe the weather every day for a month, recording their observations in the form of a bar graph....
Curated OER
Student News And Weather Channel
Fabulous! Your 5th graders should love this project. As an ongoing lesson throughout the year students use temperature probes to record outside temperature and then document their data using spreadsheets. They use their weather data and...
Curated OER
2nd Grade - Act. 28: Calendar & Weather Book
Second graders will track the weather patterns throughout the school year. This project spans the school year and takes five minutes per day or less. Measuring, data collection, and predictions are all explored throughout this relevant...
Curated OER
Weathering Lab
Assist your middle school class with one of the most inclusive weathering and erosion labs available. Individuals use sugar cubes and alka-seltzer to demonstrate the process of physical and chemical weathering. They sketch results...
Chicago Botanic Garden
Weather or Not
What is the difference between weather and climate? This is the focus question of a lesson that takes a deeper look at how weather data helps determine climate in a region. Using weather and climate cards, students decide...
Curated OER
Weather, Sea Level Rise and Climate Change
Students differentiate weather and climate. In this earth science lesson, students compare weather and climate in different regions of the world. They interpret weather graphs and compare isotherm lines of northern and southern hemisphere.
Colorado State University
If You Can't Predict the Weather, How Can You Predict the Climate?
Why is the weather man wrong so often? Young climatologists discover how chaos rules both weather and climate through a math-based activity. Using an iterative equation, the class examines how small day-to-day weather events total up to...
Montana State University
What's the Weather?
How many jackets do you need to stay warm and climb Mount Everest? An informatie resource covers the topic of Mount Everest, the resource helps young scientists discover the difference between climate and weather. Activities include...
Curated OER
Have You Looked Outside? Lesson #5- Graphing Weather Conditions
First graders study daily weather changes. In this weather and graphing lesson, 1st graders chart the daily weather for a month using stickers or weather symbols. They graph the weekly weather so that at the end of the month students...
Curated OER
Graphing the Forecast - Line Graph or Bar Graph?
Sixth graders compare and contrast bar and line graphs. Using a weather forecast of the area, 6th graders record the high and low temperatures in a table. Students determine and justify the most appropriate graph to display a given set...
Kid Zone
Groundhog's Day Graphing
This Groundhog's Day, challenge scholars to predict, estimate, tally, and graph in a weather-themed lesson in which class members play the role of the groundhog to forecast the weather come February second.
Curated OER
Weather instruments
Students explore weather instruments. In this weather lesson, students make rain gauges, anemometers, and barometers following the instructions given in the lesson. Students set up a weather station using their instruments and record and...
NOAA
Climate, Weather…What’s the Difference?: Make an Electronic Temperature Sensor
What's the best way to record temperature over a long period of time? Scholars learn about collection of weather and temperature data by building thermistors in the fourth installment of the 10-part Discover Your Changing World series....
Curated OER
Reading Graphs
Encourage kids to read line graphs with confidence using these examples and accompanying comprehension questions. Learners examine two graphs and answer four questions about each. This is definitely intended for beginners to this type of...
Curated OER
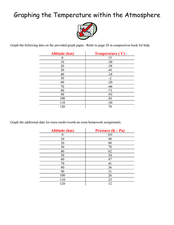
Graphing the Temperature within the Atmosphere
Musing meteorologists design graphs of the temperature and pressure changes for altitude increase in our atmosphere. The activity is pertinent to middle school earth science curriculum. Vary the type of homework you assign when teaching...
Illustrative Mathematics
Telling a Story With Graphs
Turn your algebra learners into meteorologists. Learners are given three graphs that contain information about the weather in Santa Rosa, California during the month of February, 2012. Graph one shows temperatures, graph two displays the...
US Environmental Protection Agency
Weather and Climate: What's the Difference?
Future weather forecasters collect daily temperatures over a period of time. Afterward, they compare their data with monthly averages, as researched on national weather websites, in order to grasp the difference between weather and...
Curated OER
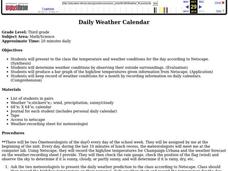
Daily Weather Calendar
Young learners will love this fun weather activity that incorporates math, science and writing. Each member of your class gets a turn becoming a meteorologist! At the end of recess, the two chosen meteorologists met the teacher at a...
National Wildlife Federation
Hot, Hotter, Hottest: Extreme Weather's Impact on Our Resources
How dry is it? It's so dry, the river only runs twice a week! Through an analysis of maps and discussions, pairs learn about droughts across the United States in the ninth of 12 lessons. They then read about, answer questions, analyze...
Virginia Department of Education
Weather Patterns and Seasonal Changes
Get your class outside to observe their surroundings with a lesson highlighting weather patterns and seasonal changes. First, learners take a weather walk to survey how the weather affects animals, people, plants, and trees during...
Virginia Department of Education
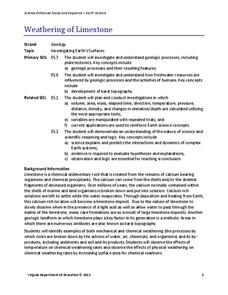
Weathering of Limestone
We all know limestone weathers, but what affects the rate of weathering? Young scientists investigate the physical and chemical weathering of limestone (chalk) through experimentation. First, they conduct trials with different-size...
Curated OER
Weather Lesson
Students discuss the weather conditions. They read thermometer, rain gauge, barometer, and wind direction and speed. They record observations of weather conditions and enter information into data base on the computer.
UAF Geophysical Institute
Observing the Weather
How can you predict the weather without any technology? Young scientists learn to forecast the weather using traditional Native American techniques. Based on their observations of the weather, as well as talking to their classmates, they...
Curated OER
Graphing the Forecast-Line Graph or Bar Graph?
Students explore bar and line graphs. In this data collection, graphing, and weather lesson, students compare bar and line graphs and discuss which type of graph would be most appropriate for displaying a ten day weather forecast....
Other popular searches
- Kindergarten Weather Graph
- Fall Weather Graph
- Daily Weather Graph
- Culture Weather Graph
- Graph Weather Chart
- Graphing Weather
- Graph Weather
- Graphing Weather Data
- Graphing Weather Activity
- Graphing the Weather
- Weather Graphs and Charts
- Weather Graph Template


