EngageNY
Interpreting the Graph of a Function
Groups sort through NASA data provided in a graphic to create a graph using uniform units and intervals. Individuals then make connections to the increasing, decreasing, and constant intervals of the graph and relate these...
Tech Museum of Innovation
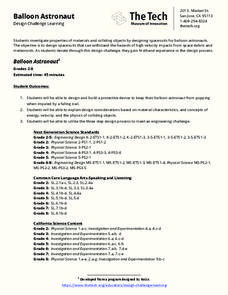
Balloon Astronaut
Design protection from high-speed particles. The STEM lesson plan highlights why astronauts need protection from space debris. Pupils use the design process to design, build, and test a spacesuit that will protect a balloon from a...
Teach Engineering
Exploring Energy: Kinetic and Potential
The potential of the energy in the class is moving. The third segment in a six-part unit on energy provides a deeper understanding of kinetic and potential energy. Learners understand the relationship between mass, speed, and energy and...
Curated OER
Bloodstain Pattern Simulations: A Physical Analysis
Students receive bloodstain pattern evidence from a crime scene. They answer a series of questions through inquiry, observation, measurement, and analysis. Pupils complete this challenge, by reconstructing the evidence through four...
Bowels Physics
Refraction and Lenses
Every object we see must pass through a lens, but how does each individual's lens differ? Learners explore the science behind refraction and lenses, uncovering the details that allow them to perform daily activities.
LABScI
Kinematics: The Gravity Lab
Falling objects can be brutal if you don't protect your noodle! Scholars explore the motion of falling objects through measuring short intervals to determine if the distance traveled varies with time. Building off of this, scholars...
Curated OER
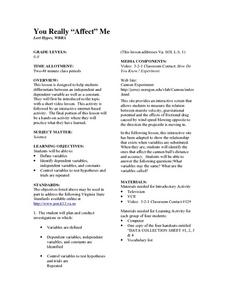
You Really "Affect" Me
Middle schoolers examine the effects of variables. They view a video which introduces the concepts, take part in an internet-based activity, then engage in a hands-on activity which allows them to practice what they have been studying.
Curated OER
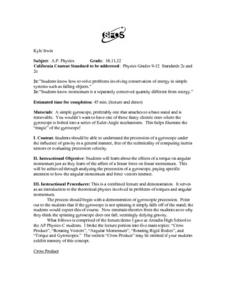
Gyroscopes in Motion
Physics stars will enjoy learning about the conservation of energy as you demonstrate gyroscope precession. The lecture is broken into five subtopics: cross product, rotating vectors, angular momentum, rotating rigid bodies, and torque...
Curated OER
Free Up the Ketchup!
Students, in teams, use given materials and their knowledge of Newton's First Law to create a device that will remove a sticky ping pong ball from a 16-oz. cup (which represents ketchup stuck in a bottle.)
Curated OER
Freestanding Structures: A Tech Museum Floor Activity
Students attempt to design the tallest structure that they can with the given materials which are wooden dowels and rubber bands. They discuss the physics of their structure and how they would improve it the next time they built a...
Teach Engineering
Can You Take the Pressure?
Do not let the pressure get to you. The first lesson in a unit of 22 introduces the concept of air pressure. Using background knowledge, the resource gives teachers the information they need to discuss how people measure air pressure and...
Curated OER
Swinging Pendulum
Students engage in an activity which demonstrates how potential energy (PE) can be converted to kinetic energy (KE) and back again. Given a pendulum height, students calculate and predict how fast the pendulum will swing by understanding...
Teach Engineering
Equal and Opposite Thrust in Aircraft: You're a Pushover!
It's the law—every action requires a reaction, no matter how small. Pupils experience two demonstrations of Newton's third law of motion as it relates to thrust in the 10th segment of a 22-part unit on flight. Using their mathematical...
Curated OER
Speed
Fifth and sixth graders practice working in pairs to determine whether they can walk with constant speed. They test themselves, collect their data, draw graphs with their data collected, manipulate the data, and then draw conclusions...
Explore Learning
Quadratics: Polynomial Form
Throught this subscription-based sight, learners explore different aspects of the parabola by changing equations from standard to vertex form. Next, find the general form of the vextex based on the values of a, b, and c, and investigate...
Curated OER
Finding Ocean Depth
How to oceanographers measure the sea's depth? Your scientists will step into their shoes in this application worksheet, first reading about how the speed of sound and a simple formula give scientists a depth estimation. Students...
Curated OER
Worksheet 3: Graphing Speed and Time
In this graphing speed and time worksheet, students answer 7 questions regarding graphing, speed, distance, derivatives, Newton's method and wheel radius.
Curated OER
States of Matter
Properties in measurement, pressure and viscosity of solids, liquids, and gases are the main topics covered in this slideshow. The explanations of Pascal's, Bernoulli's, and the Venturi effects are very clear. Easy to understand diagrams...
Curated OER
Season Worksheet #5
Sunrise, sunset, swiftly fly the years! Your earth scientists can also fly through a year of daylight data. They analyze a graph and then answer five multiple choice questions about the rising and setting of the sun, the total number of...
Curated OER
Technology for Studying Comets
Students design an Aerogel model to capture clay particles. In this space science lesson, students discover what happens to comets as they hit a surface. They explain how the Aerogel technology would help scientists study comets better.
Curated OER
Spectral Lines
Slides and slides of emission spectra bring this topic to light for your physics class! Exited electrons returning to lower energy levels is offered as the cause of emission spectra. In summary, viewers learn that we can determine the...
Curated OER
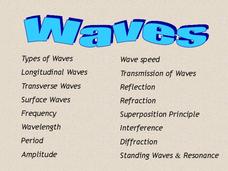
Waves
Although this was written to accompany a specific textbook, the information can illustrate wave motion for any advanced level physics course. The slides are simple, use plain but colorful fonts, and include diagrams and pictures to...
Curated OER
Atoms, Molecules and Ions
Atomic theory, experiments that contributed to our knowledge of matter, atomic structure, isotopes, and ions are covered in these 33 slides. Quality diagrams and labeled charts will help activate understanding. The presentation concludes...
Curated OER
Unit VII Energy: WS 1 Qualitative Analysis - Pie Charts
For each of eight diagrams of objects in motion, physics masters draw pie charts to depict the changes in energy. For each they must identify the energy conditions at each position. This is a unique worksheet, perfect for assessing how...
Other popular searches
- Speed Velocity Acceleration
- Constant Velocity
- Velocity and Acceleration
- Average Velocity
- Speed and Velocity
- Angular Velocity
- Average Speed and Velocity
- Relative Velocity
- Speed & Velocity
- Terminal Velocity
- Escape Velocity
- High Velocity Impacts


