EngageNY
Calculating Conditional Probabilities and Evaluating Independence Using Two-Way Tables (part 1)
Being a statistician means never having to say you're certain! Learners develop two-way frequency tables and calculate conditional and independent probabilities. They understand probability as a method of making a prediction.
EngageNY
Calculating Probabilities of Events Using Two-Way Tables
Tables are useful for more than just eating. Learners use tables to organize data and calculate probabilities and conditional probabilities.
EngageNY
Calculating Conditional Probabilities and Evaluating Independence Using Two-Way Tables (part 2)
Without data, all you are is another person with an opinion. Show learners the power of statistics and probability in making conclusions and predictions. Using two-way frequency tables, learners determine independence by analyzing...
Science Geek
Calculations of Solution Concentration
Teach the process of calculating concentrations of a solute. The fourth in a series of seven chemistry lessons shows the various types of calculations including grams per liter, molarity, parts per million, and percent composition. The...
Curated OER
Equilibrium Calculations
The equilibrium constant does not change — as long as the temperature remains unchanged. Here's presentation that briefly reviews equilibrium constants before working through four practice problems, including three calculating the Keq...
EngageNY
Using Tree Diagrams to Represent a Sample Space and to Calculate Probabilities
Cultivate the tree of knowledge using diagrams with two stages. Pupils create small tree diagrams to determine the sample space in compound probability problems. The lesson uses only two decision points to introduce tree diagrams.
Chicago Botanic Garden
Calculating Your Ecological Footprint
You can lower your ecological footprint by recycling! Lesson four in this series of five has individuals, through the use of a computer, calculate their ecological footprints. Through discussions and analysis they determine how many...
Science Geek
pH Calculations
Performing calculations is for more than just mathematicians — it's an important science skill, too. Demonstrate the pH calculations using the slide show resource. The final resource of a seven-part unit introduces young scientists to...
Physics Classroom
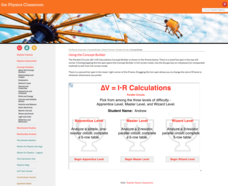
Parallel Circuits - ∆V = I•R Calculations
Parallel circuits often provide less of a challenge for teens than parallel parking. An installment of a series on parallel electric circuits requires learners to solve increasingly difficult levels of calculations. Each level provides...
Illustrative Mathematics
Solar Eclipse
Learners take on the role of astronomers, calculating conditions necessary for a total solar eclipse. Concepts of similar triangles and properties of circles come together as pupils create ratios and use real measurements in determining...
EngageNY
Using a Curve to Model a Data Distribution
Show scholars the importance of recognizing a normal curve within a set of data. Learners analyze normal curves and calculate mean and standard deviation.
EngageNY
Using Expected Values to Compare Strategies
Discover how mathematics can be useful in comparing strategies. Scholars develop probability distributions for situations and calculate expected value. They use their results to identify the best strategy for the situation.
EngageNY
Using Sample Data to Compare the Means of Two or More Populations II
The 23rd segment in a series of 25 presents random samples from two populations to determine whether there is a difference. Groups determine whether they believe there is a difference between the two populations and later use an...
EngageNY
Describing Distributions Using the Mean and MAD
What city has the most consistent temperatures? Pupils use the mean and mean absolute deviation to describe various data sets including the average temperature in several cities. The 10th lesson in the 22-part series asks learners to...
EngageNY
Describing Variability Using the Interquartile Range (IQR)
The 13th instructional activity in a unit of 22 introduces the concept of the interquartile range (IQR). Class members learn to determine the interquartile range, interpret within the context of the data, and finish by finding the IQR...
Illustrative Mathematics
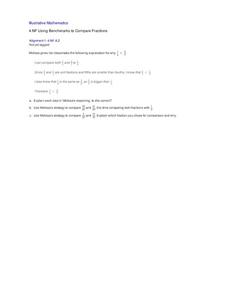
Using Benchmarks to Compare Fractions
Introduce a new strategy for comparing fractions by analyzing Melissa's use of benchmarks. Walk the class through her process, calling on students to explain their understanding of each step she took. Then practice this method on two...
EngageNY
Using Sample Data to Estimate a Population Characteristic
How many of the pupils at your school think selling soda would be a good idea? Show learners how to develop a study to answer questions like these! The lesson explores the meaning of a population versus a sample and how to interpret the...
West Contra Costa Unified School District
Using Derivatives to Graph Polynomials
You can learn to graph as well as a calculator using calculus. The lesson introduces using derivatives to find critical points needed to graph polynomials. Pupils learn to find local maximums and minimums and intervals of increase and...
EngageNY
Why Are Vectors Useful? 1
How do vectors help make problem solving more efficient? Math scholars use vectors to represent different phenomenon and calculate resultant vectors to answer questions. Problems vary from modeling airplane motion to the path of a robot.
EngageNY
Using Linear Models in a Data Context
Practice using linear models to answer a question of interest. The 12th installment of a 16-part module combines many of the skills from previous lessons. It has scholars draw scatter plots and trend lines, develop linear models, and...
CK-12 Foundation
Adding and Subtracting Matrices: The Matrix Calculator
Discover the procedure to add and subtract matrices. Pupils use the interactive and discover the pattern in adding and subtracting matrices. Scholars adjust the entries in the addends and see the resulting changes in the sum. They also...
Big Kid Science
Measuring Shadows Using an Ancient Method
How did ancient peoples determine the height of really tall objects? Young scientists and mathematicians explore the concept of using shadows to measure height in a hands-on experiment. Paired pupils measure shadows, then calculate the...
CK-12 Foundation
When to Use the Distributive Property: Rational Expressions
Discover how the distributive property applies to division. As learners change numeric values within an expression, the simulation calculates its value. Challenge questions lead individuals to realize the power of distributing the...
CK-12 Foundation
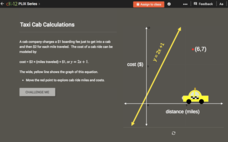
Checking Solutions to Equations: Taxi Cab Calculations
Ride to success in checking solutions to equations. Scholars use an interactive graph to identify points that are solutions to a linear equation. Interpreting these points in terms of the context completes the activity.
Other popular searches
- Calculator Use
- Calculator Use Square Use
- Calculator Use Percentages
- How to Use Calculator
- How to Use a Calculator
- Calculator Use in Algebra
- Graphing Calculator Use
- Calculator Use Lesson


