Curated OER
Graphing of Time and Distance
In this graphing time and distance worksheet, students graph data of a two race cars as they drive over time. Students plot the time vs. the distance for both cars and answer questions about the data. They determine the speed of the cars...
InqueryPhysics
Interpreting Motion Graphs
Every movement in the world can be measured and even motionless objects can be significant indicators of movement. Focus on motion graphs that feature distance vs. time, speed vs. time, and positive and negative acceleration.
It's About Time
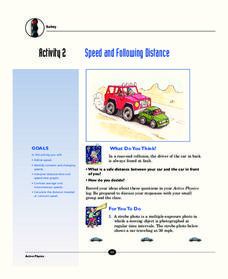
Speed and Following Distance
How much distance should you keep between your car and the one in front of you? Did you think of an answer in terms of time when the question clearly stated distance? The lesson covers the relationship between distance, time, and speed....
EngageNY
Graphs of Functions and Equations
Explore the graphs of functions and equations with a resource that teaches scholars how to graph functions as a set of input-output points. They learn how the graph of a function is the graph of its associated equation.
Education Development Center
Distance, Rate, and Time—Walking Home
Dig into a classic math problem with your classes. Through an engaging task, learners work with rate and distance information to make conclusions. In the task, two people walk at different rates; one leaves first, and scholars calculate...
Curated OER
Drive the Data Derby
Three days of race car design and driving through the classroom while guessing probability could be a third graders dream. Learn to record car speed, distances traveled, and statistics by using calculation ranges using the mean, median,...
Curated OER
Math: Real Time and Live
Get an interdisciplinary edge. Scholars study air contamination and slope. They record the time it takes for air fresheners to reach them at variable distances. They document their times, classify them by distance, and draw a scatter...
Curated OER
Chart Your Course
Students explore change represented in graphs comparing distance and time. They exchange and share their graphs. Students interpret and create distance versus time line-graphs, and write stories based on these graphs. They interpret a...
Curated OER
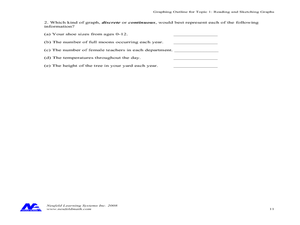
Reading and Sketching Graphs
In this graphs worksheet, students answer 15 multistep questions about graphs. Students determine distance traveled, time, velocity, and create scenarios to fit the graph.
Curated OER
Regents Exam Questions: Distance
In this distance activity, students solve 12 multiple choice, short answer, and graphing problems. Students use the distance formula to find the distance between two points.
EngageNY
Introduction to Simultaneous Equations
Create an understanding of solving problems that require more than one equation. The lesson introduces the concept of systems of linear equations by using a familiar situation of constant rate problems. Pupils compare the graphs of...
Curated OER
Exploring Quadratic Data : Transformation Graphing
High schoolers analyze the vertex form of a parabola and find an approximate fit of a model. They explain the quadratic parabola function and its properties by developing quadratic models. They use translation and dilation to change the...
Curated OER
Velocity of Traffic on Highway 26
Physics fanatics time five cars as they pass on the highway. They use the times and a 20-yard distance to calculate velocity. They also graph distance vs. time. A page of student pre-lab questions is provided in addition to the activity...
Curated OER
Walking the Plank
This is a cool math activity. Kids collect and interpret data based on a physical act. A board is balanced between a scale and a step, learners record a peer's weight as it decreases while s/he walks further away from the scale. They...
Curated OER
Regents High School Examination - Physics 2010
Give every type of learner in your physics class an opportunity to demonstrate what they have learned throughout the year. From analyzing tables and graphs, to evaluating diagrams and solving problems, there is an outstanding variety of...
Curated OER
Data Collection
Students write a journal exercise that relates to pets. They collect information from each other in order to practice making and interpreting bar graphs. They Continue building different kinds of graphs with the group.
Curated OER
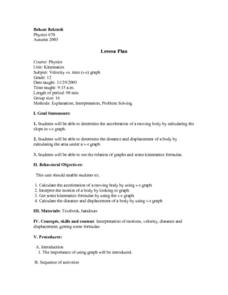
Velocity vs. Time
Twelfth graders read and interpret v-t graphs. After studying velocity and time, 12th graders read graphs to calculate the acceleration of a moving body and determine the distance and displacement of a body. Students explore the...
Balanced Assessment
All Aboard
Pupils must graph the location of a train using the time given a timetable. They analyze the different legs of the trip, graph the return trip, and compare the two graphs. The lesson ends with a discussion of similarities and differences...
NASA
Earth, Can You Hear Me Now?
How long did you say? Class groups plot the distances between Earth and Mars and determine the trigonometric function that models the data. Using a calculator, they graph the function to determine when the distance and communication...
Shodor Education Foundation
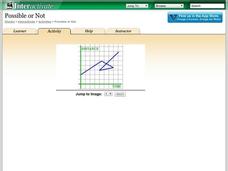
Possible or Not?
What does the graph mean? Pupils view 10 graphs and determine whether they are possible based on their contexts. The contexts are distance versus time and profit versus time.
Curated OER
Graphing Speed
For this graphing worksheet, students read about independent and dependant variables and learn how to determine speed from the slope of a position vs. time graph. This worksheet has 4 matching, 17 fill in the blank, and 2 problems to solve.
Curated OER
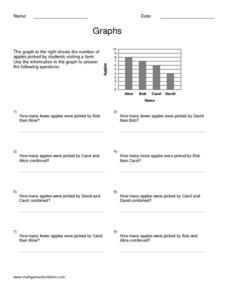
Graphs
In this graphing worksheet, students read information and study diagrams about graphing. Students complete 3 graphing activities.
Curated OER
Olympic Bar Graphs
In this Olympic bar graph worksheet, learners pick a sport from the 2004 Olympic games and find data from the Olympic web page. They graph the scores (times, distance, or speed) and the medals. They answer questions about the variables...
Curated OER
Position and Velocity vs. Time Graphs
In this position and velocity worksheet, students sketch graphs of position vs. velocity and position vs. time for 6 problems given different scenarios. They label their graphs with given positions, velocities and times.
Other popular searches
- Distance Time Graphs
- Distance Time Graphs Physics
- Distance vs Time Graphs
- Distance and Time Graphs
- Distance vs. Time Graphs
- Distance Time Graphs


