Curated OER
Affine Recurrence Plotter
Learners use the on-line affine recurrence plotter to graph equations. They work on-line to create graphs of trout in a trout pond and savings account balances when interest is compounded over time. Links to the four one-day lessons are...
Curated OER
Cartoons for the Classroom: Stand By for Regime Change
When Barak Obama was elected president, he was unable to affect change untill the official start date of January 20th. Learners examine this policy, America's need for change, and the duties of the president-elect in a political cartoon...
Curated OER
Pronoun Reference
Do your young readers have a hard time with using the correct pronouns? Use this resource to help them practice identifying and fixing incorrect pronouns. The worksheet includes twenty sentences, some of which need to be fixed, and some...
Math Worksheets Land
Partitioning Circles and Rectangles- Independent Practice
Start simple by using a shape-partitioning worksheet. Scholars begin by segmenting basic shapes in halves and quarters. On the second page, they move on to more complex shapes, such as a heart and a cross, also partitioning them in half...
Baylor College
Modeling an HIV Particle
Models are an important part of science; they help us see the world on a scale that works for us. In the first of five lessons on HIV, learners make a paper model of the HIV virus that is about 500,000 times larger than the actual virus....
Baylor College
HIV/AIDS in the United States
In the final of five lessons about HIV/AIDS, groups create presentations to share data about the infection rates in the United States, examining demographic and geographic trends over the past ten years. Depending on how much time you...
Curated OER
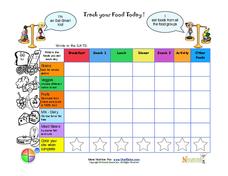
Track Your Food Today
A colorful chart to record what one eats over the course of a day. The grid is broken down to meal times and five food groups.
Colorful
There are description of each food group
Pictures of foods for each food group
Curriculum Corner
Fry Lists
Keep track of your learners' mastered sight words with 11 sets of words. Four columns list the words, as well as three columns for you to mark the date of mastery.
West Contra Costa Unified School District
Solving Equations with Variables on Both Sides
So many different ways to solve equations, so little time! Scholars learn how to solve equations with variables on both sides by using several different methods. They apply bar models, decomposition, and traditional algebraic methods to...
Curated OER
Light and Geometric Optics
It's time to see the light with a unit that focuses on light and geometric optics, including concave and convex mirrors. A variety of experiments, worksheets, and online activities are included.
CK-12 Foundation
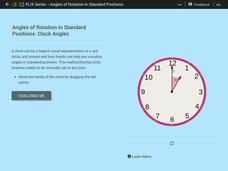
Angles of Rotation in Standards Positions: Clock Angles
Use a clock face to develop angles representing standard position angles. The interactive allows pupils to create angles using the hands of a clock. Scholars discover that there is a difference in the angle formed using a clock face and...
CK-12 Foundation
Dungeon Simulation
Tommy is stuck in a dungeon and can only escape if you can discover the correct formula for velocity! Through trial and error, scholars enter the velocity required for Tommy to reach the elevator at the proper time. Then they extrapolate...
Cornell Lab of Ornithology
Life In A Nest: Exploring Life Cycles With Bird Cams
Why read about it when you can watch it happen? Bird cams make it possible for learners to experience the life cycle of a bird in real time! An engaging set of lessons provides activities to connect their learning to bird cam...
Curriculum Corner
Meet the Teacher Event
Don't waste time making your own sign-in sheet! Instead, use this set of Meet the Teacher Night sign-up and sign-in sheets. The resource includes a sign-in sheet, volunteer preferences sign-up sheet, a parent information sheet, and...
CK-12 Foundation
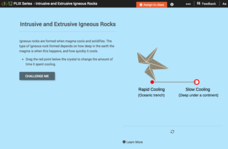
Intrusive and Extrusive Igneous Rocks
Check out a resource that's erupting with engaging material! Earth science scholars discover how igneous rocks form in a well-rounded interactive. They manipulate the cooling time of lava to watch crystals form, learn visual...
CK-12 Foundation
Sample Spaces and Events: Triple Spin!
Scholars determine the number of possible outcomes when a spinner is spun three times. They start with the case of one spin and build up to the case of three spins.
CK-12 Foundation
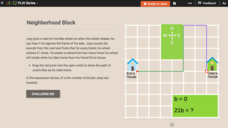
Single Variable Expressions: Neighborhood Block
The number of bicycle wheel turns is as good as any way to describe the distance from school to home. An interactive lets young mathematicians determine the number of city blocks a person bicycles. They use this information along with an...
CK-12 Foundation
Data Summary and Presentation: Chart for Grouping Data
Get social! Create a display of social media use for a class. Pupils use provided information about the time spent on social media to construct a histogram. Using the histogram, learners interpret the data to answer questions.
CK-12 Foundation
Displaying Univariate Data: Ordering Leaves
Leaf a little time to organize data. Given data displayed in a stem-and-leaf plot, learners organize the data in a list. Pupils use the data to determine the mode, median, and range of the data set. They determine the benefits of using a...
CK-12 Foundation
Understand and Create Histograms: Car Sales
Create a history of car sales. Pupils create a histogram/bar graph to show the number of car sales made during the week. Using the data display, learners calculate numerical summaries of the data and find the percent of cars sold during...
CK-12 Foundation
Mental Math to Evaluate Products: Mental Math Halloween Candy
Time to put those mental math strategies into play with an interactive that has learners thinking about how many candies three friends get altogether.
CK-12 Foundation
Broken-Line Graphs: Heating Curve of Water
Examine the unique graphs coined broken-line graphs. Using the phase change of water for data, learners answer questions related to the temperature and energy at different times in the cycle of the phase change. Questions focus on the...
CK-12 Foundation
Two-Sided Stem-and-Lead Plots: Gamers
Which gender spends more time playing video games? Your classes use provided data to answer this question. They first build a two-sided stem-and-leaf plot and then use the display to look for patterns. Guiding questions help them...
CK-12 Foundation
Logistic Functions: Fab Fitness
Strengthen your understanding of logistic functions. Young mathematicians change the carrying capacity of a logistic function and see how function values change. The function models the number of members in a gym over time.
