Curated OER
Multiplication Tables Grids
For this finding the products worksheet, students observe a multiplication explanation and example and multiply times two, three, five, and ten to complete a multiplication table grid. Students fill in 36 squares.
Curated OER
Two, Five, and Ten Times Table
In this filling in the multiplication table squares worksheet, learners use the numbers written across and down to fill in the missing products. Students solve 51 products.
Curated OER
Number Search Y5 7 x table
In this number search learning exercise, students find the 7 times table sums in the number search and circle them. They complete the sums at the bottom of the page after they have located them in the number search. The answers are on...
Curated OER
Number Search Y3 3 x Table
In this number search worksheet, students find the sums in the number search and circle them. All of the sums are from the 3 times table. After students find them in the number search, they complete them at the bottom of the page. There...
Mathematics Vision Project
Modeling Data
Is there a better way to display data to analyze it? Pupils represent data in a variety of ways using number lines, coordinate graphs, and tables. They determine that certain displays work with different types of data and use two-way...
Curated OER
Twelve Days of Christmas--Prediction, Estimation, Addition, Table and Chart
Scholars explore graphing. They will listen to and sing "The Twelve Days of Christmas" and estimate how many gifts were mentioned in the song. Then complete a data chart representing each gift given in the song. They also construct...
Mathematics Vision Project
Features of Functions
What are some basic features of functions? By looking at functions in graphs, tables, and equations, pupils compare them and find similarities and differences in general features. They use attributes such as intervals of...
California Education Partners
Linflower Seeds
How does your garden grow? Use proportions to help Tim answer that question. By using their understanding of proportional relationships, pupils determine the number of seeds that will sprout. They create their own linear relationships...
Mathematics Vision Project
Module 8: Probability
It's probably a good idea to use the unit. Young mathematicians learn about conditional probability using Venn diagrams, tree diagrams, and two-way tables. They also take into consideration independence and the addition rules.
Curated OER
Multiples of 6 #2
Count by six with these helpful activities. After completing number sequences and multiplication problems from the six times table, third graders solve problems that are written out at the bottom of the page. An excellent way to work on...
CCSS Math Activities
Smarter Balanced Sample Items: 8th Grade Math – Claim 4
A math model is a good model. A slide show presents 10 sample items on modeling and data analysis. Items from Smarter Balanced illustrate different ways that Claim 4 may be assessed on the 8th grade math assessment. The presentation is...
Mathed Up!
Tallys and Charts
After watching a brief instructional video, young mathematicians are put to the test. By completing and reading frequency tables, tally charts, and bar graphs, individuals show their understanding of how to interpret data.
Curated OER
Modeling in Algebra
In this modeling in algebra worksheet, 8th graders solve ten different types of algebra problems, including 5 word problems. They first complete each table, describe the pattern used, and determine the 20th and nth term for each....
American Statistical Association
A Sweet Task
Candy is always an effective motivator! A fun math activity uses M&M's and Skittles to explore two-way frequency tables and conditional probability. The candy can serve a dual purpose as manipulatives and experimental data.
Statistics Education Web
I Always Feel Like Somebody's Watching Me
Future statisticians and potential psychics first conduct an experiment to collect data on whether a person can tell if someone is staring at them. Statistical methods, such as hypothesis testing, chi-square tests, binomial tests, and...
Mathematics Vision Project
Module 9: Statistics
All disciplines use data! A seven-lesson unit teaches learners the basics of analyzing all types of data. The unit begins with a study of the shape of data displays and the analysis of a normal distribution. Later lessons discuss the...
Curated OER
K-5 Mathematics Module: Number and Number Sense
Reinforce number sense with a collection of math lessons for kindergarteners through fifth graders. Young mathematicians take part in hands-on activities, learning games, and complete skills-based worksheets to enhance proficiency in...
Mathed Up!
Cumulative Frequency and Box Plots
Learn how to display data. Young data analysts watch a video to review how to create cumulative frequency histograms and box plots. They work on a set of questions to practice producing these data displays.
Curated OER
Are You Full of Hot Air?
Explore the concept of measuring and recording circumference. For this physical science and measurement lesson, young learners blow up balloons, measure the circumference, and record the data on an interactive graphing website.
Illustrative Mathematics
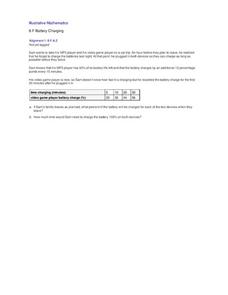
Battery Charging
Your class will be very interested in the results of this activity. How long does it take a MP3 and video game player to charge? Sam only has an hour and the MP3 player only has 40% of its battery life left. Plus, his video player is...
College Board
Is That an Assumption or a Condition?
Don't assume your pupils understand assumptions. A teacher resource provides valuable information on inferences, assumptions, and conditions, and how scholars tend to overlook these aspects. It focuses on regression analysis, statistical...
Alcohol Education Trust
Talk About Alcohol: How Much Alcohol is in a Drink?
Introduce your class to alcohol content. In order to become aware of the varying strengths of alcoholic drinks, class members complete a chart and plot a bar chart with the results. They make observations about the results.
Curated OER
Favourite Colours
In this colors worksheet, students survey 20 people on what their favorite color is. They mark the results using tallies. Students then take their data and put the totals in a frequency table.
Yummy Math
Diapers
Most of your learners probably think a car or college is the first big expense their parents could help them with, but as it turns out these kids have been costing their parents for their whole lives. Have they ever considered how much...
Other popular searches
- Using Table of Contents
- Table of Contents Index
- Table of Contents Sheets
- Table of Contents Worksheets
- Using a Table of Contents
- Table of Contents and Index
- Table of Contents Learning
- Table of Contents Lessons
- Using the Table of Contents
- Table of Contents, Headings


