Google
Surveys and Estimating Large Quantities
Looking for an estimation activity a bit more involved than the typical "guess the number of jellybeans in the jar" game? Here, learners use a picture to estimate the number of people at a large event, look for potential problems with...
Curated OER
Bar Graphs and Survey Questions- Internet Access
For this graphing and data collection activity, students examine a bar chart that show data collected from 1998 - 2006 that shows the percentage of households that have Internet access. They answer questions based on the chart and make...
Math Moves U
Collecting and Working with Data
Add to your collection of math resources with this extensive series of data analysis worksheets. Whether your teaching how to use frequency tables and tally charts to collect and organize data, or introducing young...
Bowland
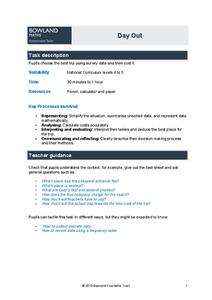
Day Out
Use mathematics to help plan a field trip. Scholars use the results of a survey to determine where a class should go on a field trip. They use provided data about entrance fees and mileage to calculate the cost per person of such a...
Noyce Foundation
Through the Grapevine
Teach statistics by analyzing raisins. A thorough activity provides lesson resources for five levels to include all grades. Younger pupils work on counting and estimation, mid-level learners build on their understanding of the measures...
Noyce Foundation
Ducklings
The class gets their mean and median all in a row with an assessment task that uses a population of ducklings to work with data displays and measures of central tendency. Pupils create a frequency chart and calculate the mean and median....
Los Angeles County Office of Education
Assessment For The California Mathematics Standards Grade 6
Test your scholars' knowledge of a multitude of concepts with an assessment aligned to the California math standards. Using the exam, class members show what they know about the four operations, positive and negative numbers, statistics...
Virginia Department of Education
May I Have Fries with That?
Not all pie graphs are about pies. The class conducts a survey on favorite fast food categories in a lesson on data representation. Pupils use the results to create a circle graph.
Curated OER
Beatrix Potter Book Survey
In this survey activity, students ask classmates which Beatrix Potter books they have read and record their responses. Book titles are listed in the first column and tally marks are written in the second column. Students then graph the...
Beyond Benign
Ecological Footprint
How does your lifestyle measure up in terms of your ecological footprint? Young ecologists examine their impact on the planet using an insightful online calculator. A short quiz asks users to rank the size of their homes, their energy...
Willow Tree
Data Sampling
Some say that you can make statistics say whatever you want. It is important for learners to recognize these biases. Pupils learn about sample bias and the different types of samples.
Bowland
Public Transport
"Statistics is the grammar of science" -Karl Pearson. In the assessment task, learners read a claim made by a newspaper and analyze its conclusions. They need to think about the sample and the wording of the given statistics.
Mathematics Assessment Project
A Day Out
An applicable task presents a problem for pupils to solve: where to go for a class field trip. The pupils must take into consideration the first and second choices of members of the class when determining where to go. Individuals also...
Curated OER
Student Opinions Survey
In this student opinions survey worksheet, students solve and complete 3 different problems related to conducting a students survey of opinions. First, they describe in detail a practical method for selecting a sample that uses voluntary...
Virginia Department of Education
Organizing Topic: Data Analysis
Learners engage in six activities to lead them through the process of conducting a thorough analysis of data. Pupils work with calculating standard deviations and z-scores, finding the area under a normal curve, and sampling...
Balanced Assessment
Who's Left?
If you're not right-handed, are you wrong-handed? Young statisticians calculate the percentage of left-handed people using a given data set in the assessment task. They plot data on a scatter plot and consider how the line of best fit...
EngageNY
Putting the Law of Cosines and the Law of Sines to Use
Use the Law of Cosines and the Law of Sines to solve problems using the sums of vectors. Pupils work on several different types of real-world problems that can be modeled using triangles with three known measurements. In the process,...
Willow Tree
Histograms and Venn Diagrams
There are many different options for graphing data, which can be overwhelming even for experienced mathematcians. This time, the focus is on histograms and Venn diagrams that highlight the frequency of a range of data and overlap of...
California Education Partners
Colorful Data
Scale up your lessons with a performance task. Young data analysts work through an assessment task on scaled bar graphs. They answer questions about a given scaled bar graph on favorite colors, analyze a bar graph to see if it matches...
Curated OER
Using Random Sampling to Draw Inferences
Emerging statisticians develop the ability to make inferences from sample data while also working on proportional relationships in general. Here, young learners examine samples for bias, and then use random samples to make...
Curated OER
Math Skills-Writing Scientific Notation
In this scientific notation worksheet, learners perform basic math functions and express their answers in scientific notation.
Curated OER
Boy Scout Merit Badge: Surveying
In this boy scout merit badge: surveying learning exercise, 8th graders research the websites listed to answer 8 detailed questions about first aid, surveying projects, GPS, the impact of surveying and careers.
Curated OER
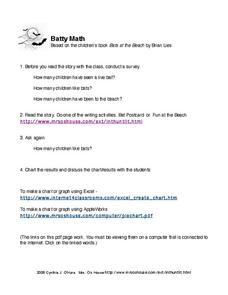
Batty Math
In this bats worksheet, students click on the link to read a story about bats and then answer short answer questions, take a survey, and create graphs about it. Students complete 4 tasks total.
Curated OER
Birthdays Survey and Tally List
In this birthday tallying worksheet, students survey classmates and fill out a tally chart of what day every person's birthday is on. Students also make a tally chart about birthday months and years. This page is intended to be an online...


