Curated OER
Technology Integration Project Weather Unit Plan
Students use a variety of technology-assisted weather observation tools to observe and record local weather. They identify, measure and record weather conditions, summarize types of clouds and make graphs of their observations. Students...
Curated OER
Getting it Right! An Investigation of the Pythagorean Theorem
In order to learn about the Pythagorean Theorem, young mathematicians investigate relations and patterns between different sides of a right triangle to look for possible relations among the squared sides. Once they have established the...
Georgia Department of Education
Math Class
Young analysts use real (provided) data from a class's test scores to practice using statistical tools. Not only do learners calculate measures of center and spread (including mean, median, deviation, and IQ range), but...
Teach Engineering
Viscous Fluids
Elasticity and viscosity. Help your class understand the similarities and differences with an introduction to viscous fluids. After describing four types of fluid behaviors: shear thinning, shear thickening, Bringham plastic,...
EngageNY
The Mean Absolute Deviation (MAD)
Is there a way to measure variability? The ninth resource in a series of 22 introduces mean absolute deviation, a measure of variability. Pupils learn how to determine the measure based upon its name, then they use the mean...
American Statistical Association
What is the Probability of “Pigging Out”
Learners apply their understanding of luck to a probability experiment. They play a game of Pass the Pigs to determine the probability of a specific outcome. Using analysis for their data, pupils declare the measures of center, dot...
Mathematics Vision Project
Geometric Figures
Logical thinking is at the forefront of this jam-packed lesson, with young mathematicians not only investigating geometric concepts but also how they "know what they know". Through each activity and worksheet, learners wrestle with...
Curated OER
Landscapes of the Mind
Students review Emily Dickinson's biography and examine themes and forms of some of her poems. They measure ways Graham integrates aspects of Dickinson's life and the themes and forms of her poetry into Letters to the World.
Curated OER
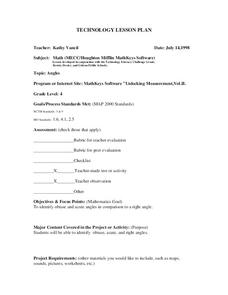
Angles
Learners identify obtuse and acute angles in comparsion to a right angle. They identify obtuse, acute, and right angles. Pupils use "Shape Measure" to construct obtuse, acute, and right angles. They review line segements to locate right...
Teach Engineering
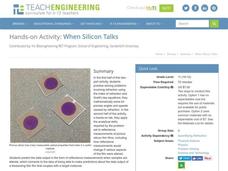
When Silicon Talks
Explore Snell's Law using thin films. In the fifth installment of a seven-part series, pupils solve a set of problems relating to Snell's Law and use this skill during an experiment requiring the collection of reflective measurements...
Curated OER
As a Matter of Fact
Elementary-aged scientists discover that all matter has mass. They are shown the difference between mass and weight, and learn how to calculate mass using the appropriate tools and methods. The scientific method is used while estimating...
Curated OER
A Book About Me
How big is your foot? How long is your arm? How big is your mom’s hand? After learning how to measure body parts, young writers collect their observations into an illustrated book. Instructions for crafting a 3D Tim Foil Man are also...
Curated OER
Trends of Snow Cover and Temperature in Alaska
Students gather historical snow cover and temperature data from the MY NASA DATA Web site. They compare this data to data gathered using ground measurements from the ALISON Web site for Shageluk Lake. They graph both sets of data and...
Curated OER
Radiation Comparison Before and After 9-11
Using the NASA website, class members try to determine if changes could be detected in cloud cover, temperature, and/or radiation measurements due to the lack of contrails that resulted from the halt in air traffic after the attacks...
Teach Engineering
Ramp and Review (for High School)
Rolling for momentum. As part of a study of mechanical energy, momentum, and friction, class members experiment rolling a ball down an incline and having it collide with a cup. Groups take multiple measurements and perform...
Teach Engineering
Earthquakes Living Lab: FAQs about P Waves, S Waves and More
Let's talk about earthquakes .... Using the Internet, pupils research what causes earthquakes, how scientists measure them, their locations, and their effects. The resource is not only informative, but it also builds crucial...
Balanced Assessment
Blirts and Gorks
Start a trend by using blirts and gorks as your standard unit of measures. The activity asks learners to take a known measures of blirts and gorks and develop a conversion ratio. Individuals use both perimeter and area measures of...
Virginia Department of Education
Out of the Box
There's no need to think outside the box for this one! Scholars measure the length, width, and height of various boxes. Results help develop the formulas for the surface area and volume of rectangular prisms.
Curated OER
Supplementary, Complementary, and Vertical Angles
By using circles that they cut out and label themselves, learners literally "get a grip" on the angles they identify: supplementary, complementary, and vertical. They solve missing measurements based on properties of supplementary,...
Alabama Learning Exchange
What You Know About the Bermuda Triangle?
Get lost in the classifications. Using the backdrop of the Bermuda Triangle, pupils classify it by angle and side measures. They also learn information about the triangle and its history.
Curated OER
Bouncing Ball : Function Families
A bouncing ball serves as more than entertainment when learning to apply quadratic functions to real-world events. This is the second of a two-part lesson, which can also be accessed from the website. The instructions say to measure the...
Mathematics Assessment Project
Maximizing Area: Gold Rush
Presenting ... the gold standard for a lesson. Learners first investigate a task maximizing the area of a plot for gold prospecting. They then examine a set of sample student responses to evaluate their strengths and weaknesses.
Teach Engineering
Can You Take the Pressure?
Do not let the pressure get to you. The first lesson in a unit of 22 introduces the concept of air pressure. Using background knowledge, the resource gives teachers the information they need to discuss how people measure air pressure and...
Inside Mathematics
Hopewell Geometry
The Hopewell people of the central Ohio Valley used right triangles in the construction of earthworks. Pupils use the Pythagorean Theorem to determine missing dimensions of right triangles used by the Hopewell people. The assessment task...
Other popular searches
- Non Standard Measurement
- Standard Measurement Chart
- Standard Measurement Rulers
- Standard Measurement System
- American Standard Measurements
- Math Standard Measurement
- Unit Standard Measurement
- Standard Measurement History
- Using Standard Measurement
- Standard Measurement of Length
- Standard Measurement (Hand)
- Standard Measurementrating=3


