Utah Education Network (UEN)
Microwave Magic
The microwave is a staple in many American households, but how exactly does it work? Approach this question from a scientific and practical standpoint, and discover cooking strategies, recipes, and methodologies for the standard...
Texas State Energy Conservation Office
Investigation: Insulation
Youngsters compare the heat-holding abilities of three different cans by insulating two with different materials and measuring the temperature change of hot water over a 20-minute period.
NASA
Raisin Bread Universe
What is the universal breakfast? The resource includes two activities, the first one observing oatmeal to understand the texture of the universe. Then, scholars measure raisin bread dough before and after it rises to represent the...
Charleston School District
Scientific Notation and Appropriate Units
How do you write a number in scientific notation? The handout and video provide an explanation on how to convert from standard form into scientific notation and vice versa. The resource also contains a short discussion about choosing...
Teach Engineering
Ice, Ice, PV!
Knowing the temperature coefficient allows for the calculation of voltage output at any temperature. Groups conduct an experiment to determine the effects of temperature on the power output of a solar panel. The teams alter the...
EngageNY
Truncated Cones
Learners examine objects and find their volumes using geometric formulas in the 21st installment of this 25-part module. Objects take the shape of truncated cones and pyramids, and individuals apply concepts of similar triangles to find...
Shodor Education Foundation
Stem and Leaf Plotter
The key is in the leaves. Pupils enter data to create a stem-and-leaf plot. The resource then displays the plot and calculates the mean, median, and mode of the data. Using the plot and the calculated measures of spread, learners analyze...
Flipped Math
Intro to Trigonometry
Expand trigonometric ratios beyond right triangles. Pupils start with a review of trigonometric ratios and then take a look at angles in standard position to determine their measurements. Scholars discover how to find coterminal angles...
NASA
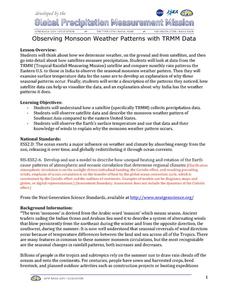
Observing Monsoon Weather Patterns with TRMM Data
Follow a fabulous slide show on how monsoons form and how satellite technology is being used to observe the phenomena, explaining why they occur. Afterward, visit the TRMM (Tropical Rainfall Measuring Mission) website to access actual...
Kenan Fellows
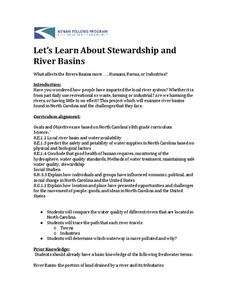
Let's Learn About Stewardship and River Basins
What does it mean to be a good steward? Middle school environmentalists learn to care for their state's waterways through research, a guest speaker, and poster activity. Groups must locate and learn more about a river basin and the human...
EngageNY
Mid-Module Assessment Task - Precalculus (module 1)
Individuals show what they know about the geometric representations of complex numbers and linearity. Seventeen questions challenge them to demonstrate their knowledge of moduli and operations with complex numbers. The assessment is...
CK-12 Foundation
At the Crossroads
Young scientists investigate methods of comparing standard and metric units with a technology-enhanced lesson that builds a connection between conversion ratios and the corresponding units. The simulation allows learners to...
NOAA
Investigating Sea Level Using Real Data
The news reports on rising sea level, but how do scientists measure this rise? Scholars use NOAA data including maps, apps, and images to work through five levels of activities related to sea level. Each level in the series adds a new...
College Board
2005 AP® Statistics Free-Response Questions Form B
Here's another great way to learn from the past. Released free-response questions provide a look into how concepts measured on the 2005 AP® Statistics Exam on Form B. Teachers and pupils review questions that cover concepts such as...
US Department of Commerce
Census in Counties - Describing and Comparing Histograms to Understand American Life
Use graphs to interpret life in 136 counties. Pupils analyze histograms and describe the shapes of the distributions of data collected from several counties on different aspects of life. Scholars make predictions on the difference in...
Curated OER
Introduction to Statistics: Mean, Median, and Mode
Students explore the concepts of mean, median, and mode. They develop an understanding and familiarity with these concepts. Students explore mean and median in an efficient way. Students explore three different measures of center.
Curated OER
Cumulative Frequency - Mental Tests
In this measures of central tendency worksheet, quick-thinking pupils use mental math to find the mean, median, and range of samples. They use mental math to calculate subtraction problems. They complete 20 problems in which the answers...
Curated OER
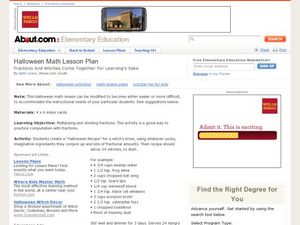
Halloween Math Lesson Plan
Students practice their multiplication and division by creating a Witches Brew. In this holiday math lesson, students utilize Halloween style ingredients to create a fun edible treat for themselves. Students practice their...
Curated OER
Estimation and Measurement
Students use unconventional units of measure to estimate and measure.
Curated OER
Measuring Where We Sit In The Universe
Pupils investigate scientific measurement. They use a variety of scales to do the job and communicate the results correctly. The teacher uses socratic questioning throughout the lesson plan checking for comprehension. Students measure...
Curated OER
Measurement Investigations 2
Students complete a number of practical measuring investigations, with an emphasis on accuracy of measuring and communication of their findings. They examine how to measure by first becoming aware of the physical attributes of objects...
Curated OER
Measurement Investigations 1
Fifth graders find perimeters, areas, and volumes of everyday objects and state the precision. They work in small groups in order to take measurements, perform calculations, and write a group report about the investigation.
Curated OER
Length and Area
Fourth graders measure one centimeter cubed blocks to determine their size. They measure lines using a worksheet that is not included in the activity. Next, they measure the area of figures on the sheet using the cubes in place of a ruler.
Curated OER
Measure Each Line to the Nearest Inch
For this math worksheet, learners solve 8 problems in which they measure lines to the nearest inch with a standard ruler. There are no examples.
Other popular searches
- Non Standard Measurement
- Standard Measurement Chart
- Standard Measurement Rulers
- Standard Measurement System
- American Standard Measurements
- Math Standard Measurement
- Unit Standard Measurement
- Standard Measurement History
- Using Standard Measurement
- Standard Measurement of Length
- Standard Measurement (Hand)
- Standard Measurementrating=3


