Curated OER
States Of Matter
Delv into the states of Matter. Students engage in the scientific inquiry process to uncover the exciting world of Matter. They watch a series of videos, and conduct experiments in order to collect and analyze data on the various state...
Curated OER
The Southeast Anatolia Project
This resource is amazing. It is a full project including teacher notes, handouts, procedure, and worksheets. It introduces learners to the GAP project, a social environmental group working to bring irrigation, assistance, and increased...
Curated OER
Exploring Data Sets and Statistics in Baseball
High schoolers explore the concept data sets. In this data sets lesson, students find the 5 number summaries for salaries of teachers and compare them with 5 number summaries of professional baseball players. High schoolers use box and...
Curated OER
Interpreting Data and Statistics using Graphs
Seventh graders interpret data. In this lesson on types of graphs, 7th graders construct, interpret, and analyze different graphs. This lesson includes worksheets and resources.
Curated OER
Organizing Data
In this organizing data worksheet, 7th graders solve seven different types of problems related to data. They first identify the type of data as categorical, discrete or continuous from the information given. Then, students use Excel to...
Curated OER
Data Management and Probability: Applications
For this data management and probability applications worksheet, 8th graders solve 20 various types of probability problems. They find the mean, median, mode and range of various numbers. Then, students use the spinner illustration to...
EngageNY
Describing Distributions Using the Mean and MAD
What city has the most consistent temperatures? Pupils use the mean and mean absolute deviation to describe various data sets including the average temperature in several cities. The 10th lesson plan in the 22-part series asks learners...
Virginia Department of Education
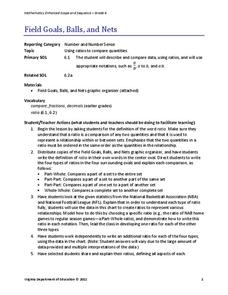
Field Goals, Balls, and Nets
Score a resource on ratios. Young mathematicians learn about different ways to express ratios. Using sports data, they write statements about the statistics in ratio form.
American Statistical Association
An A-MAZE-ING Comparison
Teach your class how to use descriptive statistics through a hands-on data collection activity. Pupils collect their own data, calculate test statistics, and interpret the results in context. They compare male and female results, looking...
EngageNY
Creating a Dot Plot
Which dot am I? Pupils create dot plots to represent sample data through the use of frequency tables. The third segment in a series of 22 asks individuals to analyze the dot plots they created. The scholars translate back and forth...
National Council of Teachers of Mathematics
Eruptions: Old Faithful Geyser
How long do we have to wait? Given several days of times between eruptions of Old Faithful, learners create a graphical representation for two days. Groups combine their data to determine an appropriate wait time between eruptions.
Curated OER
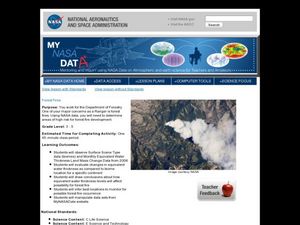
Forest Fires
Students play the role of a Ranger with the Department of Forestry. In this forest fires instructional activity, students examine data on biomes and images to determine high risk areas for forest fires to develop.
American Statistical Association
Don't Spill the Beans!
Become a bean counter. Pupils use a fun activity to design and execute an experiment to determine whether they can grab more beans with their dominant hand or non-dominant hand. They use the class data to create scatter plots and then...
Regents Prep
Activity to Show Sample Population and Bias
There is bias in many aspects of our lives, and math is no exception! Learners explore provided data to understand the meaning of biased and random samples. The resource includes various data sets from the same population, and...
101 Questions
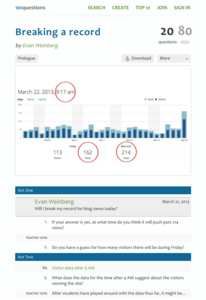
Breaking a Record
Can we break the record? Groups use provided data detailing the number of visitors to a blog to determine if the number of blog views breaks the previous record. They must take rates into consideration to make their estimates—a great...
Curated OER
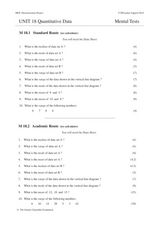
Unit 18 Quantitative Data
In this central tendency worksheet, students answer 30 short answer questions about data sets. Students find the median, mean, mode, and range of data sets.
Curated OER
Assessing and Investigating Population Data
Students examine population projections. In this population data lesson, students research and collect data on the population of the United States. They explore and conclude future population growth patterns. Students construct tables...
Curated OER
Are We Couch Potatoes or Busy Bees? Data Analysis of Physical Activity in School
Young scholars study practical data analysis within the constraints of the scientific method. For this data lesson students collect and enter data into a computer spreadsheet then create graphs.
Curated OER
Analyzing Data Sets
For this analyzing data sets worksheet, 11th graders solve and complete 35 various types of problems that include the analysis of data given. First, they determine the equation that best describes the data shown in a table. Then,...
Curated OER
Using Data to Determine the Location of the Stiffest Opposition to School Desegregation in the 1970's
High schoolers analyze historical data. In this school desegregation lesson, students make predictions about opposition to desegregation, examine the provided desegregation data, and determine if their predictions were correct.
Curated OER
Presentation of Quantitative Data- Vertical Line Diagrams
In this quantitative data worksheet, students examine how vertical line diagrams can be used to display discrete quantitative data. They read about the use of tally charts to create vertical line graphs that display the data. They...
Curated OER
Interpreting Data and Building Hypothesis
Students define the term species, and graph species data together with previously collected data at the National Zoo. They interpret graphed data and recognize patterns in the streamside quadrant versus hillside quadrant. Students use...
American Institutes for Research
Data and Probability: Marshmallow Madness
Upper grade and middle schoolers make predictions, collect data, and interpret the data as it relates to the concept of probability. They work with a partner tossing marshmallows and recording if they land on their side or on their...
College Board
Civic Knowledge and Action: Voter Registration
What does the data say? Using provided voter data from the 2016 presidential election, scholars describe the data and identify questions they could answer by analyzing it. Learners then construct tables and use them to determine whether...
Other popular searches
- Data Set
- Analyzing Data Set
- Circle Graph Data Set
- Data Set Experiments 2nd
- Data Set Experiments
- Data Set Table
- Data Set Planets
- Mode of a Set of Data
- Socrates Data Set
- Line Graph Data Set
- Socrates Graph Data Set


