PHET
Soda Bottle Magnetometer
Introduce learners to set of complete instructions that describe how to build a magnetometer that works just like the ones professional photographers use to predict auroras. The diagrams are wonderfully descriptive, and the written...
Statistics Education Web
The Egg Roulette Game
Hard boiled or raw? Which egg will you get? A hands-on activity has scholars explore the impact of conditional probability. Based on a skit from the Tonight Show, pupils model the selection of the two types of eggs using beads. They...
NASA
MASS, MASS – Who Has the MASS? Analyzing Tiny Samples
What is it worth to you? A hands-on lesson plan asks groups to collect weights of different combinations of coins and calculate weighted averages. They use the analysis to understand the concept of an isotope to finish the third lesson...
Curated OER
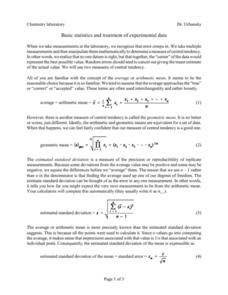
Basic Stats
In this chemistry worksheet, students focus upon the concepts of mean and standard deviation and how it is used in the laboratory to interpret data.
Education Development Center
Interpreting Statistical Measures—Class Scores
Explore the effect of outliers through an analysis of mean, median, and standard deviation. Your classes examine and compare these measures for two groups. They must make sense of a group that has a higher mean but lower median compared...
Nuffield Foundation
Investigating the Effect of Temperature on the Activity of Lipase
How does temperature affect lipase activity? Young scholars conduct an experiment to collect data on the interaction of lipase at different temperatures. They add lipase to a solution of milk, sodium carbonate, and phenolphthalein and...
Curated OER
Mean, Median and Mode (II)
In this mean worksheet, students examine given information and determine the mean, mode and median of data. This one-page worksheet contains 10 problems. Answers are provided.
Statistics Education Web
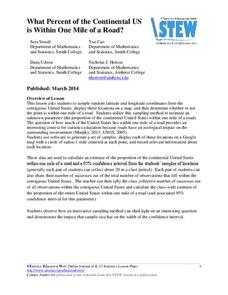
What Percent of the Continental US is Within One Mile of a Road?
There are places in the US where a road cannot be found for miles! The lesson plan asks learners to use random longitude and latitude coordinates within the US to collect data. They then determine the sample proportion and confidence...
University of Georgia
Heating and Cooling of Land Forms
Compare heating and cooling rates of different land forms. A lab activity has groups collect data on the rate of heating and cooling of soil, grass, saltwater, fresh water, and sand. An analysis of the rates shows how the different land...
LABScI
Circulation and Respiration: Vital Signs
What do your vital signs tell your doctor? An engaging hands-on lesson plan has your learners monitor their own lung capacity, blood pressure, and heart rate. They then connect the vital measures to the workings of the circulatory and...
EngageNY
Measuring Variability for Symmetrical Distributions
How do we measure the deviation of data points from the mean? An enriching activity walks your class through the steps to calculate the standard deviation. Guiding questions connect the steps to the context, so the process is not about...
K-5 Math Teaching Resources
Blank Bar Graph Template
This template is just begging for your young mathematicians to fill it in with colorful bar graphs! With horizontal and vertical axes in place and grid lines for added support, this is a great resource for teaching children how to...
Zip Grade
ZipGrade
Imagine using your smart phone or tablet to grade a class set of quizzes in less than a minute. Imagine getting immediate results and being able to give immediate feedback. No hunting for scantrons. No waiting in line for the scantron...
Radford University
The Science of Surveys
To drill or not to drill? An informative unit has scholars first research the advantages and disadvantages of oil drilling in Alaska. They set up and conduct a sample survey to assess attitudes toward oil drilling in a specific...
Curated OER
Interpreting Position vs. Time Graphs (Still Pretty Basic Stuff)
This is an interactive physics slide show that quizzes viewers about position versus time. It is set up as a series of 10 questions to answer: a graph with a questions slide followed by an answer slide. This is terrific practice in graph...
STEM for Teachers
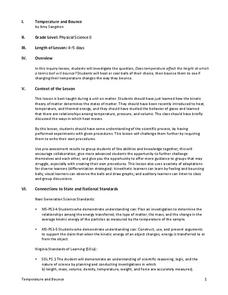
Temperature and Bounce
Take part in a fun experiment and hold an impromptu bouncing contest with your class. Young scientists heat and cool balls before bouncing them to determine whether temperature changes affect how they bounce. The set of STEM lesson plans...
Mathematics Assessment Project
Middle School Mathematics Test 3
Real-life mathematics is not as simple as repeating a set of steps; pupils must mentally go through a process to come to their conclusions. Teach learners to read, analyze, and create a plan for solving a problem situation. The provided...
EngageNY
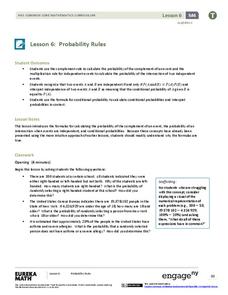
Probability Rules (part 1)
In statistics, probability rules—literally! Learners use their previous knowledge and explore a set of rules for conditional probability, independent probability, and complements. Given different scenarios, they must determine what type...
Curated OER
Learn How to Graph
Students examine various types of charts and discover how to construct a line graph. Using graph paper, they construct a graph displaying weight loss over a five-year period. They draw copnclusions from the completed graphs.
Curated OER
Home on the Range
Third graders see how to find the range of a set of numbers by analyzing data. After a lecture/demo, student pairs practice finding mode and range by solving problems put up on the board by the teacher.
Curated OER
Snow Cover By Latitude
Pupils examine computerized data maps in order to create graphs of the amount of snowfall found at certain latitudes by date. Then they compare the graphs and the data they represent. Students present an analysis of the graphs.
Curated OER
Using Statistics to Uncover More Evidence
Fifth graders participate in an online Web lesson plan on ways of interpreting data. They conduct a survey and interpret the results in a journal entry.
Curated OER
Pi Digit Distribution
Learners study graphing skills and compare and contrast data sets. They compute pi through the first 50-100 digits and create a bar graph showing the frequencies of specific digits.
Curated OER
We Are Having a Party! Part I
Second graders use data analysis skills in order to plan a class party. They graph possible times for the party noting the range for times. They discuss how mathematicians find and use the range to analyze data.
Other popular searches
- Data Set
- Analyzing Data Set
- Circle Graph Data Set
- Data Set Experiments 2nd
- Data Set Experiments
- Data Set Table
- Data Set Planets
- Mode of a Set of Data
- Socrates Data Set
- Line Graph Data Set
- Socrates Graph Data Set


