Curated OER
Problem-Solving Application: Make a Circle Graph
In this circle graphs worksheet, students analyze a data table about the activities in a day. Students then use this data to make a circle graph. Students answer 6 questions about the graph.
Curated OER
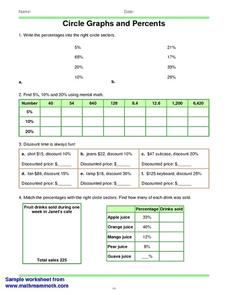
Circle Graphs and Percents
In this circle graph and percentages worksheet, learners fill in a chart, write percentages, calculate discounts, and more. Students complete 4 sets of problems.
Scholastic
Study Jams! Circle Graph
Over a pizza dinner, RJ and Mia discuss how to use a circle or pie graph to represent data. After viewing, data analysts can use a Test Yourself feature to assess their own understanding. This is ideal for use in a flipped classroom lesson.
Math Mammoth
Circles Graphs and Percents
For this percent instructional activity, students read and interpret circle graphs. They determine discounts, and match percentages with circle sectors. This one-page instructional activity contains approximately 30 problems.
Curated OER
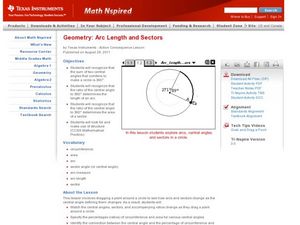
Arc Length and Sectors
Find the length of an arc. Students relate central angles to the area and length of a sector and graph circles on the TI to make predictions.
Curated OER
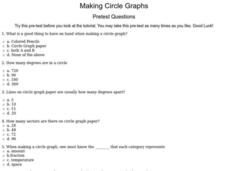
Making Circle Graphs
In this circle graphing learning exercise, 6th graders answer ten multiple choice questions based on their knowledge of circle graphs. This is an interactive learning exercise.
Curated OER
Graphs
Students investigate circle and bar graphs. In this middle school mathematics instructional activity, students determine which kind of graph is suitable for a given situation and create circle and bar graphs.
Curated OER
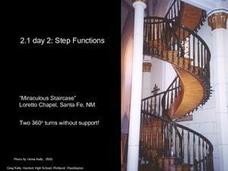
Calculus 2.1 day 2 - Step Functions
"Step functions" are sometimes used to describe real-life situations. This extensive lesson with many practice examples demonstrates two such functions: the Greatest Integer Function and the Least Integer Function. The commands on the...
Curated OER
Area Of Sectors
Student find the area of a sector of a circle. In this geometry lesson plan, high schoolers define the sector of a circle using a sketch. They find and identify examples of sector in the real world.
Curated OER
Data Handling
In this data handling worksheet, learners interpret data found in table, graphs and charts. They organize data and draw bar charts. This two-page worksheet contains 2 multi-step problems.
Mathematics Vision Project
Circles: A Geometric Perspective
Circles are the foundation of many geometric concepts and extensions - a point that is thoroughly driven home in this extensive unit. Fundamental properties of circles are investigated (including sector area, angle measure, and...
Curated OER
The Four Sectors
Students examine the four sectors of society. They identify each business in the community as either a nonprofit, for-profit or governmental business. They discuss the importance of each sector to the community.
Mathed Up!
Pie Charts
Representing data is as easy as pie. Class members construct pie charts given a frequency table. Individuals then determine the size of the angles needed for each sector and interpret the size of sectors within the context of frequency....
Teach Engineering
The Energy Problem
Think you can solve the energy problem? You'll first need to know about current energy use. Analyzing a set of circle graphs lets scholars see where energy consumption is the greatest, both by sector and by household use. They develop a...
Curated OER
Worksheet 5 - Squeeze Theorem
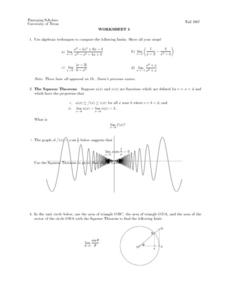
In this Squeeze Theorem worksheet, pupils compute limits, identify a graph that represents the Squeeze Theorem, and graph given functions. This two-page worksheet contains seven multi-step problems.
Curated OER
Four Sectors
Students explore the sectors of civil society. For this philanthropy lesson, students explore and categorize government, market, nonprofit, and household sectors.
Curated OER
Chapter 10: Aggregate Expenditures (The Multiplier, Net Exports, and Government)
Effectively portraying the multiplier effect and the gaps within recession and inflation periods, these slides would be a good resource for both a beginning and advanced economics class. Clear, easy-to-read graphs and charts take viewers...
Curated OER
M&Ms Count and Crunch
Students practice skills involving statistics and probability by making predictions on number of each color candy in one pound bag of M&Ms. They record both guesses and actual quantities, calculate percentages, and create bar graphs...
Bytes Arithmetic
Geometry Pad+
Graphing paper, pencil, ruler, protractor, and compass, all get replaced or supplemented with this dynamic geometry application. Here, you can create, move, and scale many different shapes, as well as, explore and change their properties...
Curated OER
Meeting Needs Four Ways: The Drive (6th)
Students study the U.S. economic sectors and their philanthropic role in communities. In this civil society lesson, students brainstorm and classify businesses in their community. Students discuss the for-profit, nonprofit, government...
Curated OER
Playing with Money (From the Other Point of View)
Young scholars explore exchange rates. They identify the units of currency of a number of countries. Students convert money amounts accurately. They graph currency fluctuations and interpret graphs.
Curated OER
Data Handling
For this data handling worksheet, 6th graders solve and complete 4 various types of problems. First, they draw a bar chart to represent the information provided in the table shown. Then, students show beneath the table how to work out...
Curated OER
Discovering Ohm's Law
Connect math with science! Pupils apply properties of Ohms Law as they solve problems and identify the inverse relationship of a function. They analyze the shape of the graph of an inverse function and use it to make predictions.
Curated OER
Collecting Data
In this data collection worksheet, students read about how data is collected and organized. They also learn about a hypothesis. Students read through examples of different charts and then answer 23 questions pertaining to data...


