EngageNY
Real-World Positive and Negative Numbers and Zero II
Continuing from the previous lesson in the series, scholars learn to use positive and negative integers to describe real-world situations. In groups, they come up with their own situations for given positive and negative integers.
EngageNY
Real-World Positive and Negative Numbers and Zero
Class members investigate how positive and negative numbers are useful in the real world. Individuals first read a short passage and identify terms indicating positive and negative numbers. They consider situations involving positive...
Mathematics Assessment Project
Linear Graphs
A line is a line is a line. As a middle school assessment task, learners first identify graphs of given linear equations. They then identify the equations that represent real-world situations.
EngageNY
Writing and Graphing Inequalities in Real-World Problems
Inequalities: when one solution just doesn't suffice. Individuals learn to write inequalities in real-world contexts and graph solution sets on the number line. All inequalities in the instructional activity are of the form x < c or x...
EngageNY
Multi-Step Problems in the Real World
Connect graphs, equations, and tables for real-world problems. Young mathematicians analyze relationships to identify independent and dependent variables. These identifications help create tables and graphs for each situation.
Curated OER
Piecewise Linear Functions: Extending Stories to Graphs
Using this resource, scholars develop graphs that model situations by showing change over time. They answer 15 questions based on information from charts that show growth in weight. They extend the concepts to an assessment section of...
EngageNY
Revisiting the Graphs of the Trigonometric Functions
Use the graphs of the trigonometric functions to set the stage to inverse functions. The lesson reviews the graphs of the basic trigonometric functions and their transformations. Pupils use their knowledge of graphing functions to model...
EngageNY
Tax, Commissions, Fees, and Other Real-World Percent Problems
Pupils work several real-world problems that use percents in the 11th portion of a 20-part series. The problems contain percents involved with taxes, commissions, discounts, tips, fees, and interest. Scholars use the equations formed for...
Curated OER
Real World Investigation- Math and Geography- Elevation Changes
In this math and geography real world investigation, 6th graders plan a driving trip to a city that is located several states away from their home while recording the elevations of three cities that are included in the trip. They use...
CCSS Math Activities
Vincent’s Graphs
What in the world are they doing? Given two graphs, scholars interpret the graphs and connect them to a real-world situation. They must also draw a graph given information about a context.
Curated OER
Double Bar Graphs - Homework 7.1
Your learners have seen basic bar graphs, but do they have experience reading double bar graphs? This worksheet details how to draw a double bar graph and provides an example with six accompanying questions. The final question asks...
Curated OER
Reading Bar Graphs #2
Raise the bar in your third grade class with this learning exercise on bar graphs. Youngsters view three graphs representing three different sets of data, and answer questions based on what they analyze. The first set is completed as an...
Curated OER
Reading Bar Graphs
Working on bar graphs in your math class? Use a thorough worksheet to reinforce graphing and problem solving skills with your third graders. After reviewing two bar graphs, young learners answer ten questions about the data represented...
Curated OER
Systems of Equations and Inequalities
This is a comprehensive activity on creating and solving equations and systems of equations and inequalities. Problems range from basic linear equations to more complex systems of equations and inequalities based on a real-world...
Curated OER
Review Linear Equations
Explore algebra I/algebra II with this series of worksheets. Pupils write linear equations in slope-intercept and standard form, graph linear equations, and apply linear equations to real world applications. The six-page worksheet...
Illustrative Mathematics
Summer Swimming
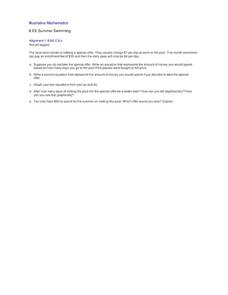
Here is a real-world application for systems of equations. When is it better to pay an enrollment fee and lower daily rate, and when is it better to pay the regular price? The local swim center is having a special offer, reductions in...
Flipped Math
Create and Analyze Graphs
Model the world with graphs. Pupils watch and participate in creating graphs to model real-world situations. The presenters stress the importance of a consistent scale and proper labels for the graphs along with identification of the...
Virginia Department of Education
Graphing Systems of Inequalities
Apply systems of inequalities to a real-world problem. Here, scholars learn to graph solutions to systems of linear inequalities. To finish the lesson plan, they solve a problem involving burgers and cheeseburgers using a system of...
Illustrative Mathematics
Chocolate Bar Sales
In this real-world example, algebra learners start to get a sense of how to represent the relationship between two variables in different ways. They start by looking at a partial table of values that define a linear relationship. They...
Curated OER
Geometric Sequences - Bacterial Growth
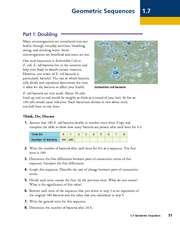
Bring algebra to life with scientific applications. Math minded individuals calculate and graph the time it takes a bacterium to double. They discuss geometric sequences and use a chart to graph their findings. There are 38 questions all...
Curated OER
Graphing Inequalities in Two Variables
This study guide is a great resource to help you present the steps to graphing linear inequalities. Show your class two different ways to graph an inequality and work on a real-world example together. The document could also be easily...
Inside Mathematics
Picking Apples
Getting the best pick of the apples depends on where to pick. The short assessment presents a situation in which class members must analyze a real-world situation to determine the cost of picking apples. The pricing structures resemble...
Curated OER
Representing Data 1: Using Frequency Graphs
Here is a activity that focuses on the use of frequency graphs to identify a range of measures and makes sense of data in a real-world context as well as constructing frequency graphs given information about the mean, median, and range...
Curated OER
Strike a Pose: Modeling in the Real World (There's Nothing to It!)
Adjust this lesson to fit either beginning or more advanced learners. Build a scatter plot, determine appropriate model (linear, quadratic, exponential), and then extend to evaluate the model with residuals. This problem uses real-world...


