Charleston School District
Review Unit 3: Functions
Time to show what you know about functions! The review concludes a series of nine lessons on the basics of functions. The problems included are modeled from the previous lessons. Pupils determine if a table represents a function,...
Mathematics Vision Project
Features of Functions
What are some basic features of functions? By looking at functions in graphs, tables, and equations, pupils compare them and find similarities and differences in general features. They use attributes such as intervals of...
Mathematics Vision Project
Module 3: Features of Functions
Learn how to represent functions in multiple ways. Learners analyze functions as equations, graphs, and verbal descriptions. The analysis includes intercepts, behavior, domain, and range. The module of seven lessons makes up the third...
Mathematics Vision Project
Module 2: Systems of Equations and Inequalities
The brother-sister pair Carlos and Clarita need your class's help in developing their new pet sitting business. Through a variety of scenarios and concerns presented to the siblings, the learners thoroughly explore systems of equations...
West Contra Costa Unified School District
Introduction to Solving Linear Inequalities in One Variable
Life isn't fair ... like inequalities. After first reviewing inequality symbols and how to read inequality statements, learners discover how to solve one-step inequalities and graph their solution sets.
Learner
Solid Shapes
A collection of two lessons, kindergartners will identify two-dimensional shapes in solid shapes. They will develop basic knowledge of the components that make up a sphere, rectangular prism, pyramid, cylinder, cone, and cube. Young...
Curated OER
A world of oil
Students practice in analyzing spatial data in maps and graphic presentations while studying the distribution of fossil fuel resources. They study, analyze, and map the distribution of fossil fuels on blank maps. Students discuss gas...
Museum of Tolerance
Where Do Our Families Come From?
After a grand conversation about immigration to the United States, scholars interview a family member to learn about their journey to America. They then take their new-found knowledge and apply their findings to tracking their family...
Curated OER
Venn Diagrams, Part 3
Can your first graders interpret Venn diagrams? Different sets of clues help pupils narrow down a specific number in different shapes. They determine odds and evens, greater than or less than, and what shape the number is in. A fun...
Curated OER
Food chains at sea
Fifth graders interpret a table of data about food chains in the ocean. They create a food chain to represent the information on the table. Periwinkles eat seaweed, and crabs eat periwinkles - so who eats crabs? Extend the activity with...
Curated OER
Farm Stories, Animal Webbing, Favorite Farm Animal Graph
Students brainstorm animals they would expect to see on a farm. They save these on a Kidspiration web. Students watch or read a farm story. They discuss the characters. Students vote for their favorite farm animal and crate a graph using...
Curated OER
Zebra Mussel Population Simulation
Students are taught how to format and enter data into an Excel spreadsheet. They make a graph, and interpret graphed data. Students discuss the possible impacts of zebra mussels on the Hudson river. They graph zebra mussel data.
Curated OER
Reading a Graph: Azimuth Range vs. Day in Barrow Alaska
Students practice reading a graph while doing story problems. They determine the x and y intercepts and calculate the slope. They also practice writing linear equations.
Curated OER
Candy Land Math
Students order numbers and sets of objects from 0 through 10 and organize and interpret information collected from the immediate environment. They read and interpret graphs usin real objects and the computer. Finally, students sort a...
Curated OER
Getting Graphs: Researching Genealogy-A Piece of Pie
Third graders research their genealogy. In this math lesson, 3rd graders collect data and create graphs and charts. A presentation of their findings is given.
Curated OER
Graphing Favorite Holidays
Students create spreadsheets and bar graphs based on results of survey of favorite holidays.
Curated OER
Investigating: Interpreting Graphs and Analyzing Data
Students explore statistics by researching class birthday data. In this data analysis lesson plan, students investigate the different birthdays among their classmates and create data tables based on the given information. Students view...
Curated OER
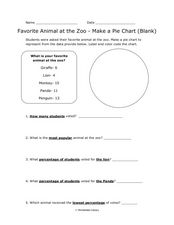
Pie Chart: Favorite Animal at the Zoo
In these three interpreting a pie chart and answering questions worksheets, students use the data provided to label and color code the blank and outlined pie charts, read and interpret a completed pie chart, and then answer questions...
Inside Mathematics
Scatter Diagram
It is positive that how one performs on the first test relates to their performance on the second test. The three-question assessment has class members read and analyze a scatter plot of test scores. They must determine whether...
It's About Time
Volcanic Hazards: Airborne Debris
Pupils interpret maps and graph data related to volcanic ash. Then they analyze the importance of wind speed and the dangers of the ash to both life, air temperature, and technology.
Mathed Up!
Pictograms
Young mathematicians read, interpret, and complete a variety of real-world pictograms. Each question includes a key and information to complete the graphs.
Inside Mathematics
Population
Population density, it is not all that it is plotted to be. Pupils analyze a scatter plot of population versus area for some of the states in the US. The class members respond to eight questions about the graph, specific points and...
Benjamin Franklin High School
Saxon Math: Algebra 2 (Section 9)
Section 9 of the 12 linked Saxon Math sections introduces the young algebrist to graphing periodic functions, creating graphs from quadratic roots, working with inequalities, and rational equations. Common among all the lessons is the...
Curated OER
Science Jeopardy
Wow! Review an entire semester of biology curriculum playing this Science Jeopardy game! The variety of topics is extremely broad, so you will need to review each question to find if they all apply to your course. As you find material...


